
Appearance
Workforce Planning: forecast accuracy, supply projection and internal mobility
Three newer screens of Workforce Planning answer: was our headcount plan right, how many people will we have in 12 months, and do people move inside the company. They all rest on one thing the HR record does not keep: monthly headcount snapshots. The planning screens themselves are in Workforce Planning.
1. What it is and who uses it
| Role | What they do |
|---|---|
| HR / workforce planner (tenant administrator) | Takes a snapshot each month, reads Forecast Accuracy to judge the plans, reads Supply Projection to size hiring. |
| Finance, HR leadership | Read the three screens (Report.View). |
2. Before you start
- Installed plugin:
hcm-workforce-planning(free tier; needs HCM Foundation and Employee). - Access: tenant administrators, or Report.View for reading. Only a tenant administrator can take or remove a snapshot.
- Needs: an approved headcount plan for the year (Headcount Planning) whose department name matches the organisation unit name, and at least one snapshot. Without them the screens say so.
- Trial data: generate the Workforce Planning pack in Demo Data: seven approved FY2026 plans and twelve months of snapshots for those departments.
3. Set up
Take the first snapshot. Open Forecast Accuracy and choose Take this month's snapshot. It records, for each department, the active people, those who joined this month (by hire date), and, compared with the previous snapshot, the leavers and the people who moved in or out. Take one each month; taking the month again replaces it. The first snapshot has no earlier one, so leavers and moves are counted from the second.
Make sure each approved plan names its department exactly as the organisation unit is named.
4. Daily use
4.1 Judge the plans: Forecast Accuracy
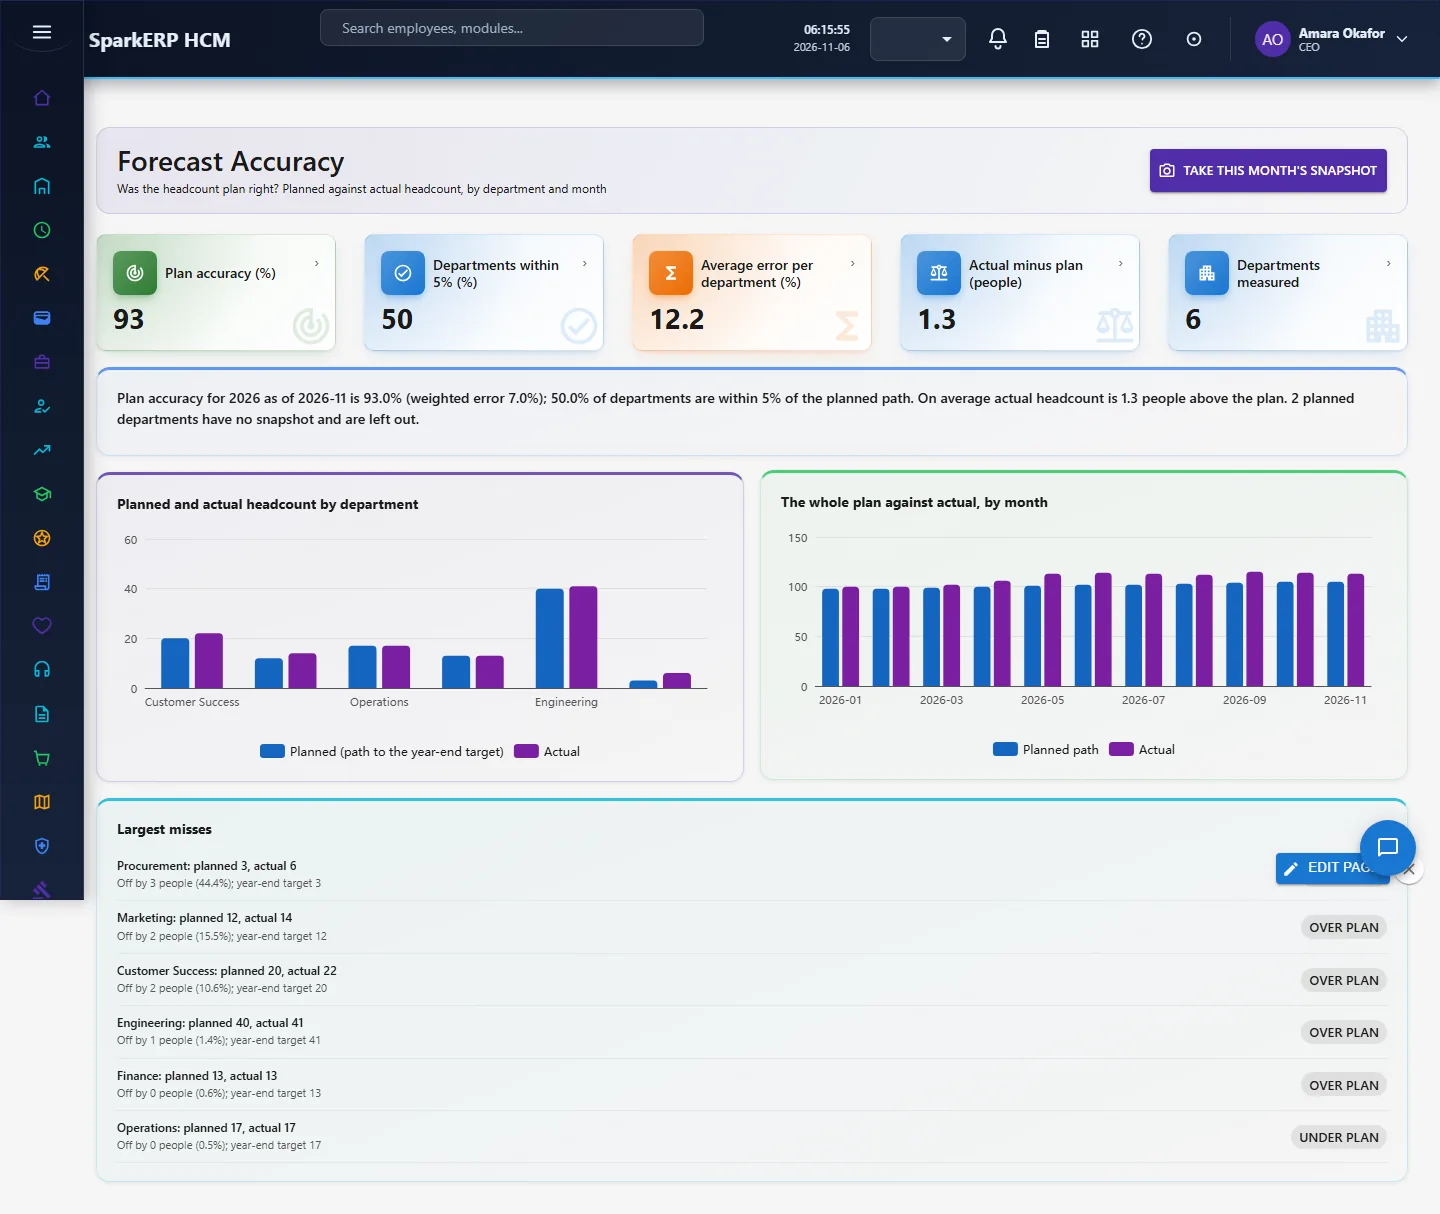
The plan holds one target, the year-end headcount, so the planned path is a straight line from the plan's starting headcount to that target. Each month the screen compares the actual headcount of the latest snapshot with the planned path for that month.
- Plan accuracy = 100 minus the weighted error (the total of all departments' misses divided by the total actual headcount), so a one-person department cannot swamp the figure.
- Departments within 5% = the share of departments whose miss is at most 5% of their actual headcount.
- Average error per department = the plain mean of the departments' error rates (more sensitive to small departments).
- Actual minus plan = the average difference: above 0 the plan was too low.
- Largest misses lists departments by error, over or under plan.
No standard defines a headcount forecast error, so these definitions are ours and written here.
4.2 Size the hiring: Supply Projection
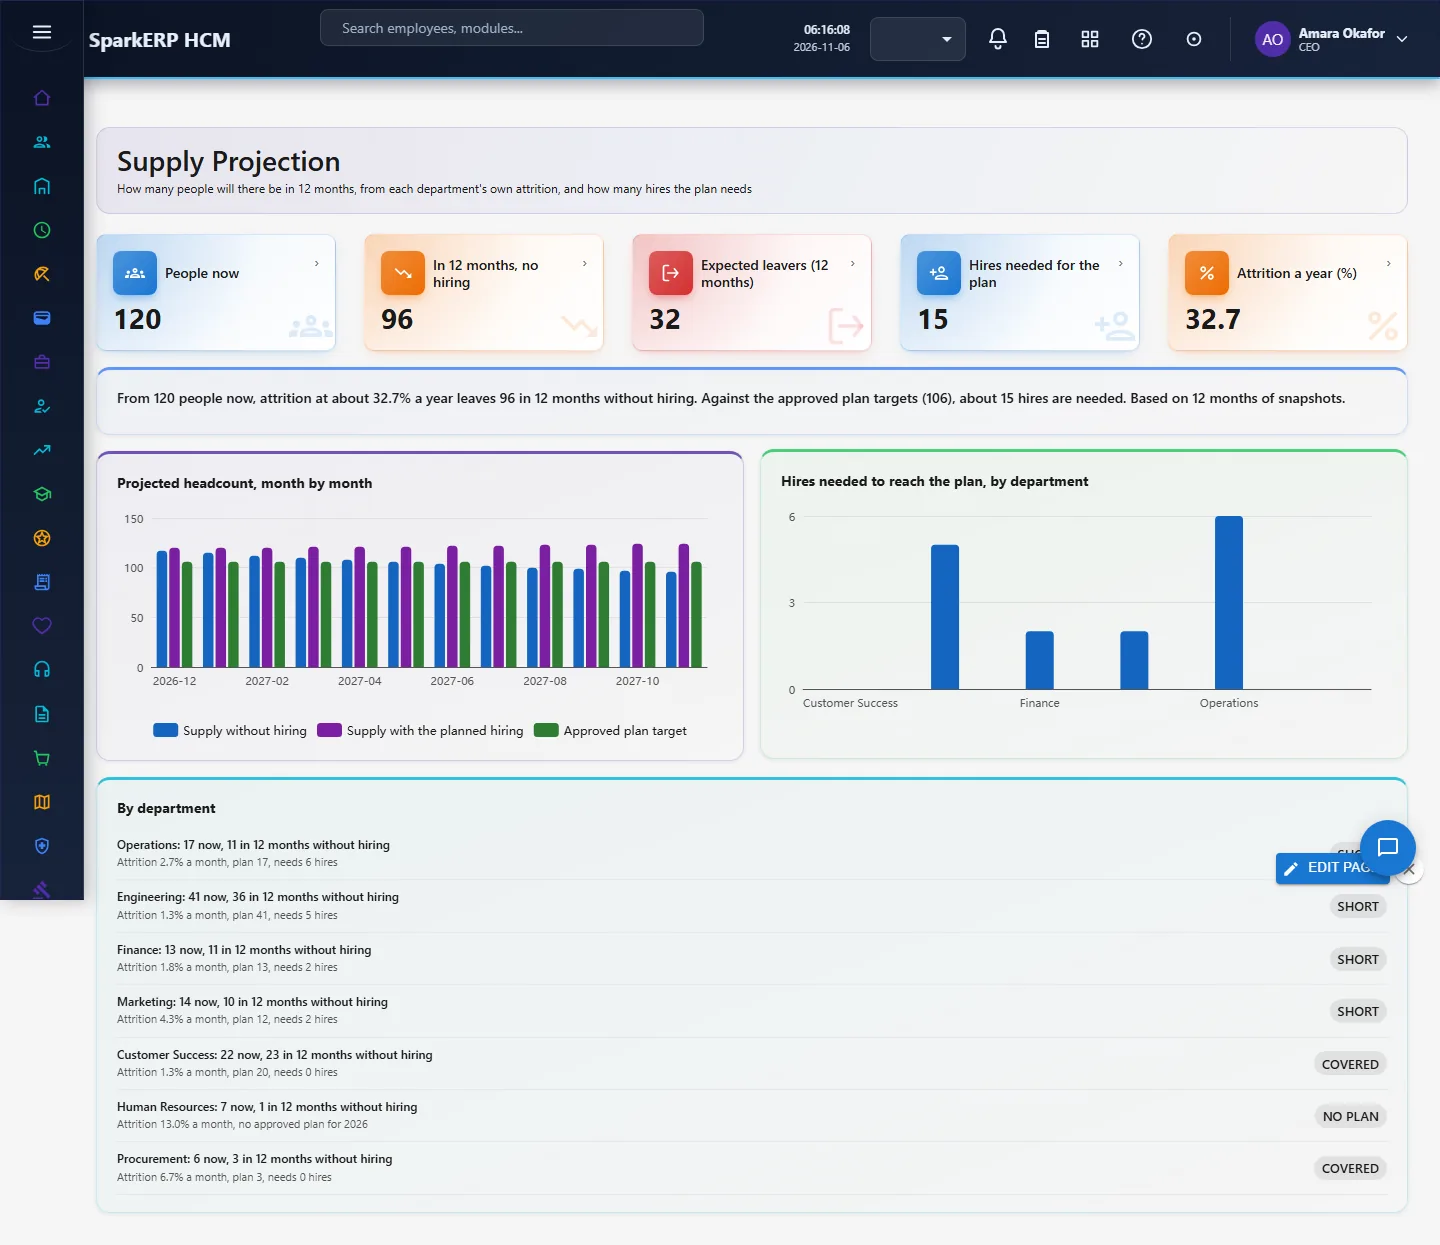
For each department the screen takes the headcount now, applies that department's own monthly attrition (leavers over the average headcount in its snapshots; a department with under three months of history uses the organisation's rate), adds the average net moves, and, for the second line, the plan's hiring spread over the year. It shows the projection month by month, the hires needed to reach each approved target after attrition, and a row per department (short, covered, or no plan).
Retirements are not projected: that would need everyone's age. Leavers already include people who retired.
4.3 See movement: Internal Mobility
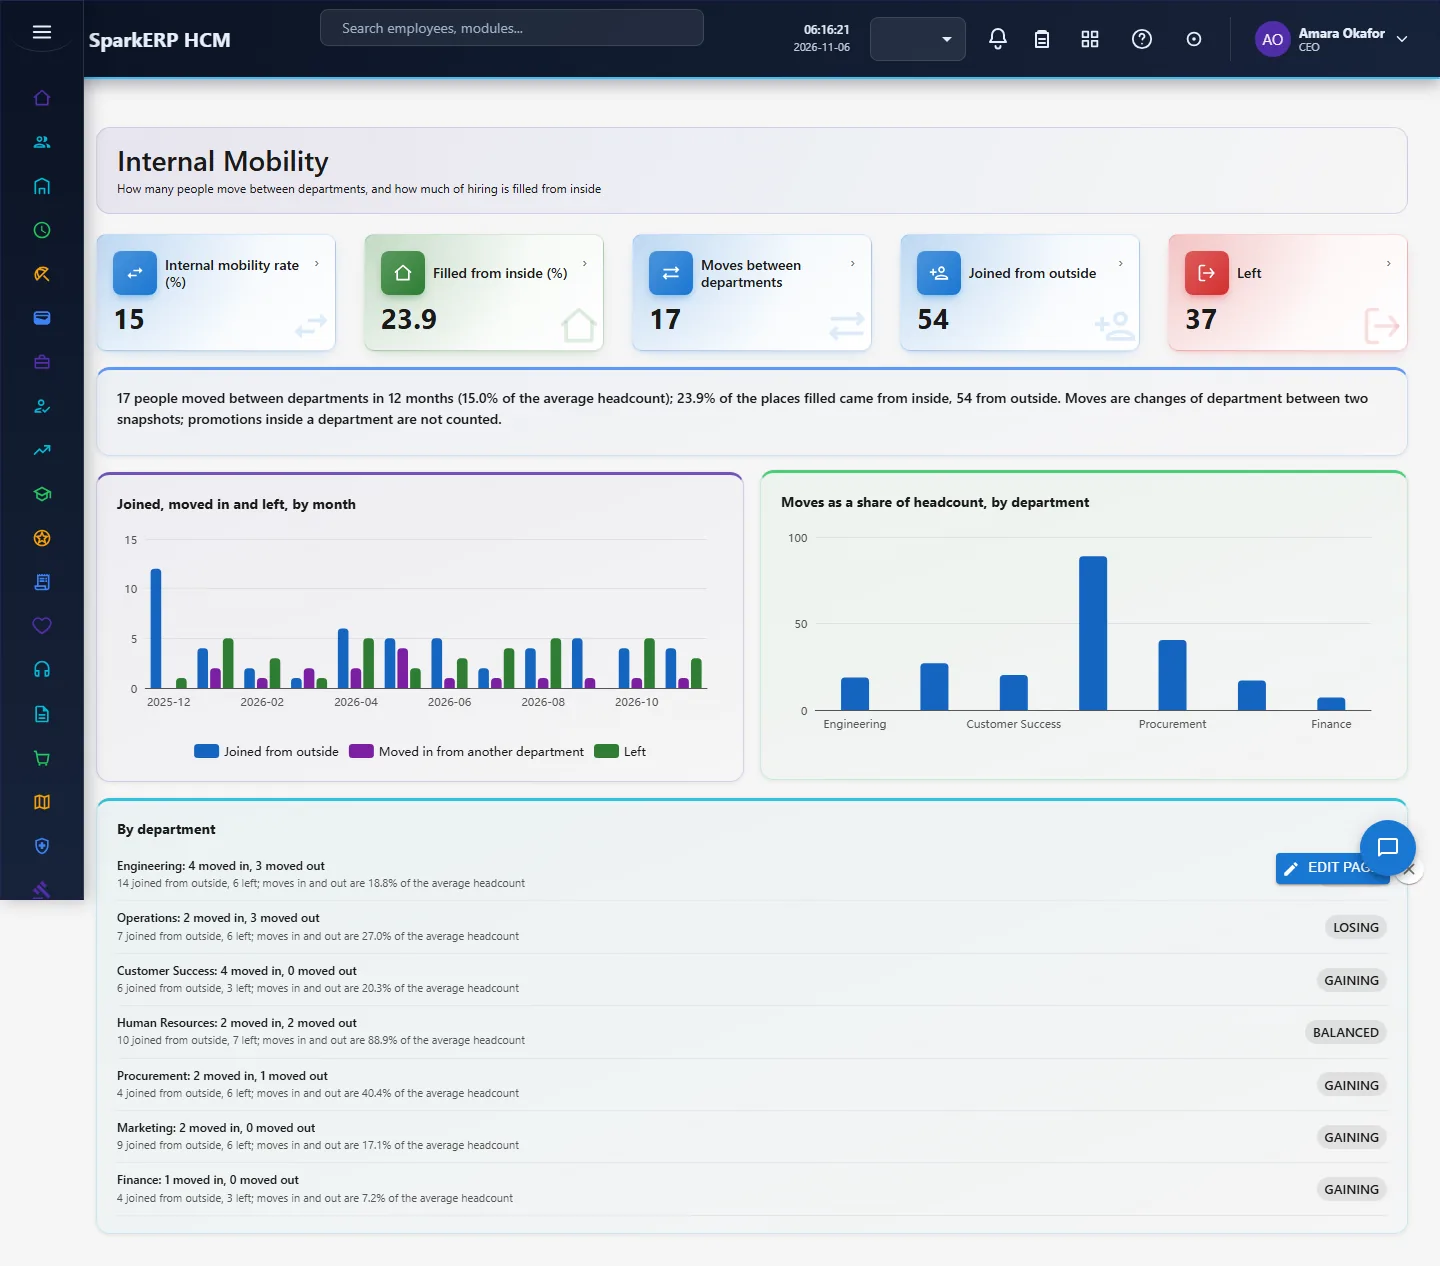
Internal mobility rate = moves between departments in the last 12 months over the average headcount. Filled from inside = moves into departments over (moves plus joiners from outside). A move is a change of department between two snapshots (a promotion inside a department is not counted). The charts show joiners, moves and leavers by month and the moves of each department.
5. Charts, reports and exports
Each screen has five tiles, a sentence that says what the numbers mean, two charts and a list. The sentence also names what is left out (for example planned departments with no snapshot).
6. On a phone or tablet
All three screens work on a phone: tiles and charts stack, and the lists read one under the other.
7. Rules and limits
- Figures are only as good as the snapshots: with fewer than six months the rates are rough, and the screen says so.
- Snapshots are taken by hand once a month (no automatic job yet). A snapshot cannot be taken for the past from today's data: it reflects who is active now.
- A department is matched to its plan by name, not by id.
- Not built: forecast accuracy by role or location, retirement projection, hazard-rate or cohort attrition models, vacancy chains, benchmarks.
8. Troubleshooting
| Symptom | Cause and fix |
|---|---|
| "No snapshot has been taken yet" | Take one on Forecast Accuracy (administrator). |
| "N planned departments have no snapshot" | The plan's department name differs from the organisation unit name. |
| No approved plan for the year | Approve a headcount plan for the year of the latest snapshot. |
| Attrition looks too high or low | Few months of history, or a snapshot taken twice in a month. Take one per month. |
| Forbidden | Your login is not a tenant administrator and lacks Report.View. |