
Appearance
Workforce Planning: how it works and how to set it up
Workforce Planning answers the questions a company asks when it plans its people for the year ahead: how many people do we have, how many should we have, how much will it cost, what happens if we grow faster or slower, where are the skill gaps, was last year's plan right, how many people will we have next quarter, and how much do we fill roles from inside. This guide explains how the module works from start to finish, then how to set it up, then what each person sees. Every screen has its own page in the Workforce Planning section; this guide is the one to read first.
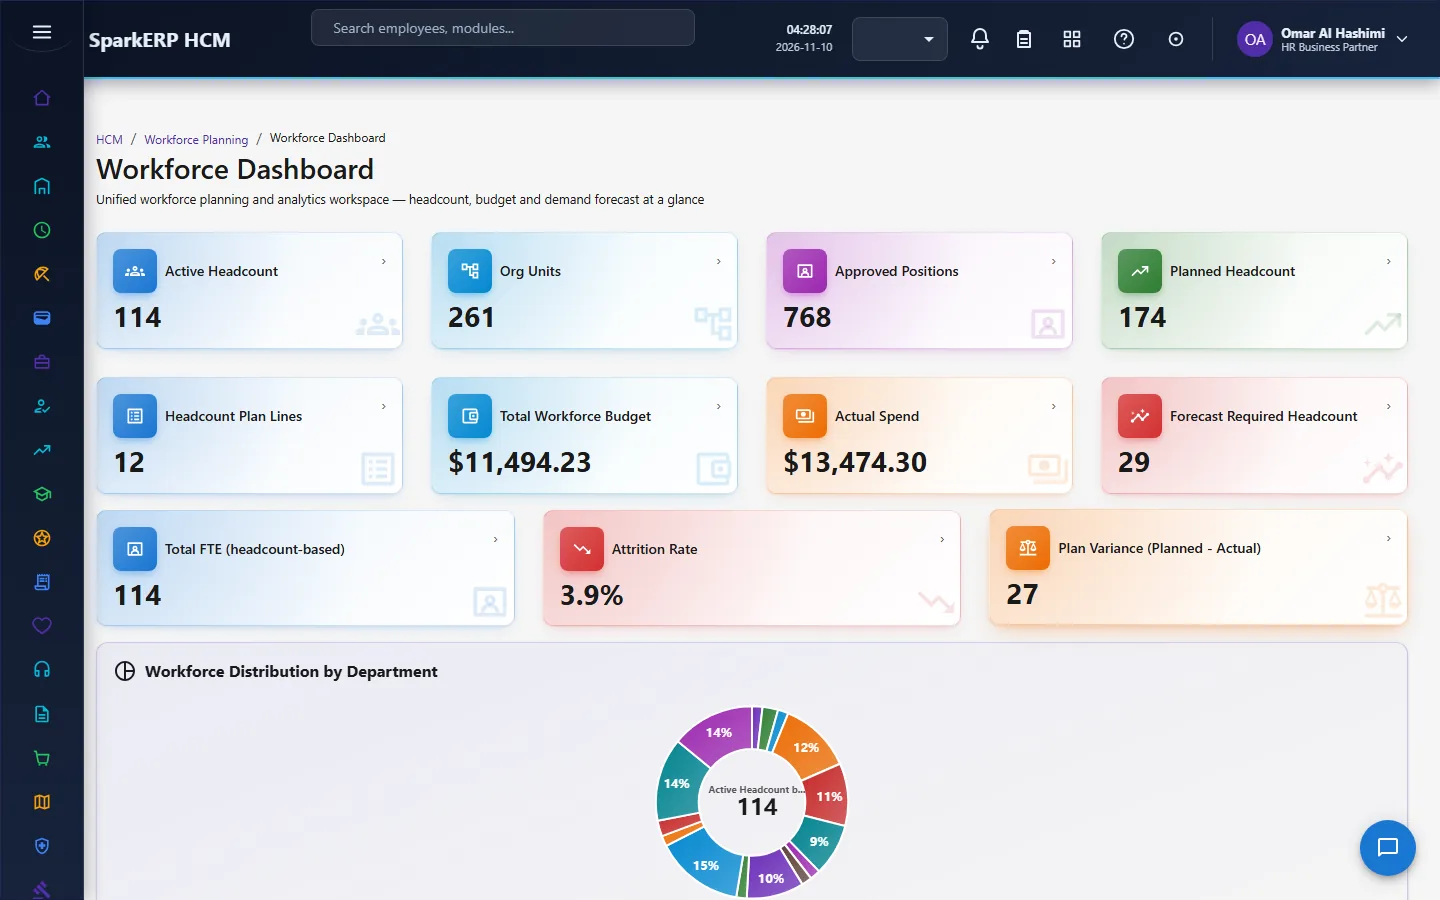
1. What Workforce Planning does for your business
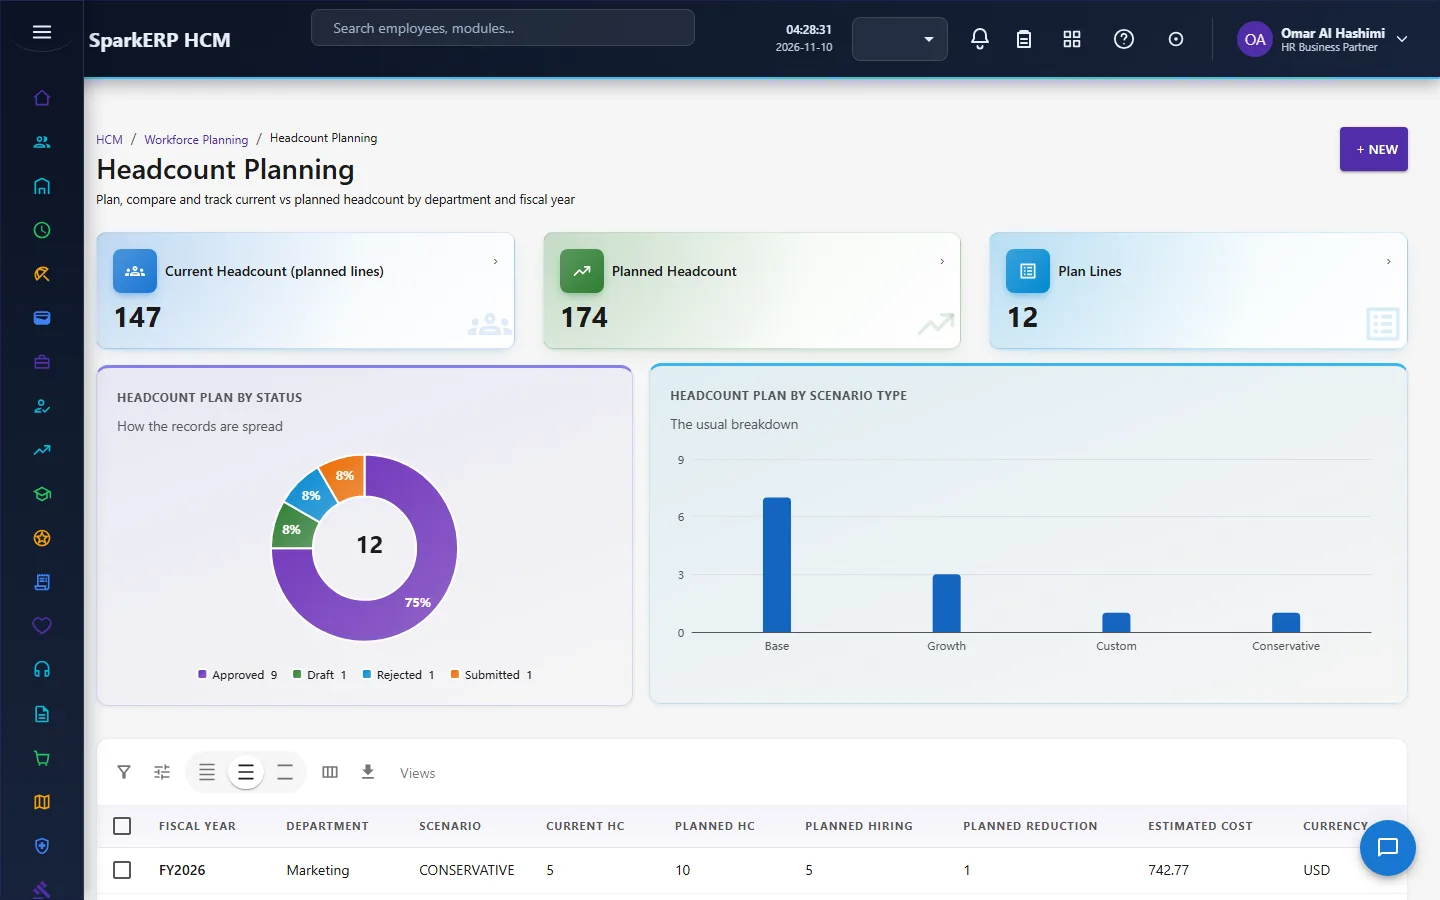
- Plans headcount by fiscal year, department and scenario: the current headcount, the planned headcount, the planned hiring and reduction, and the estimated cost.
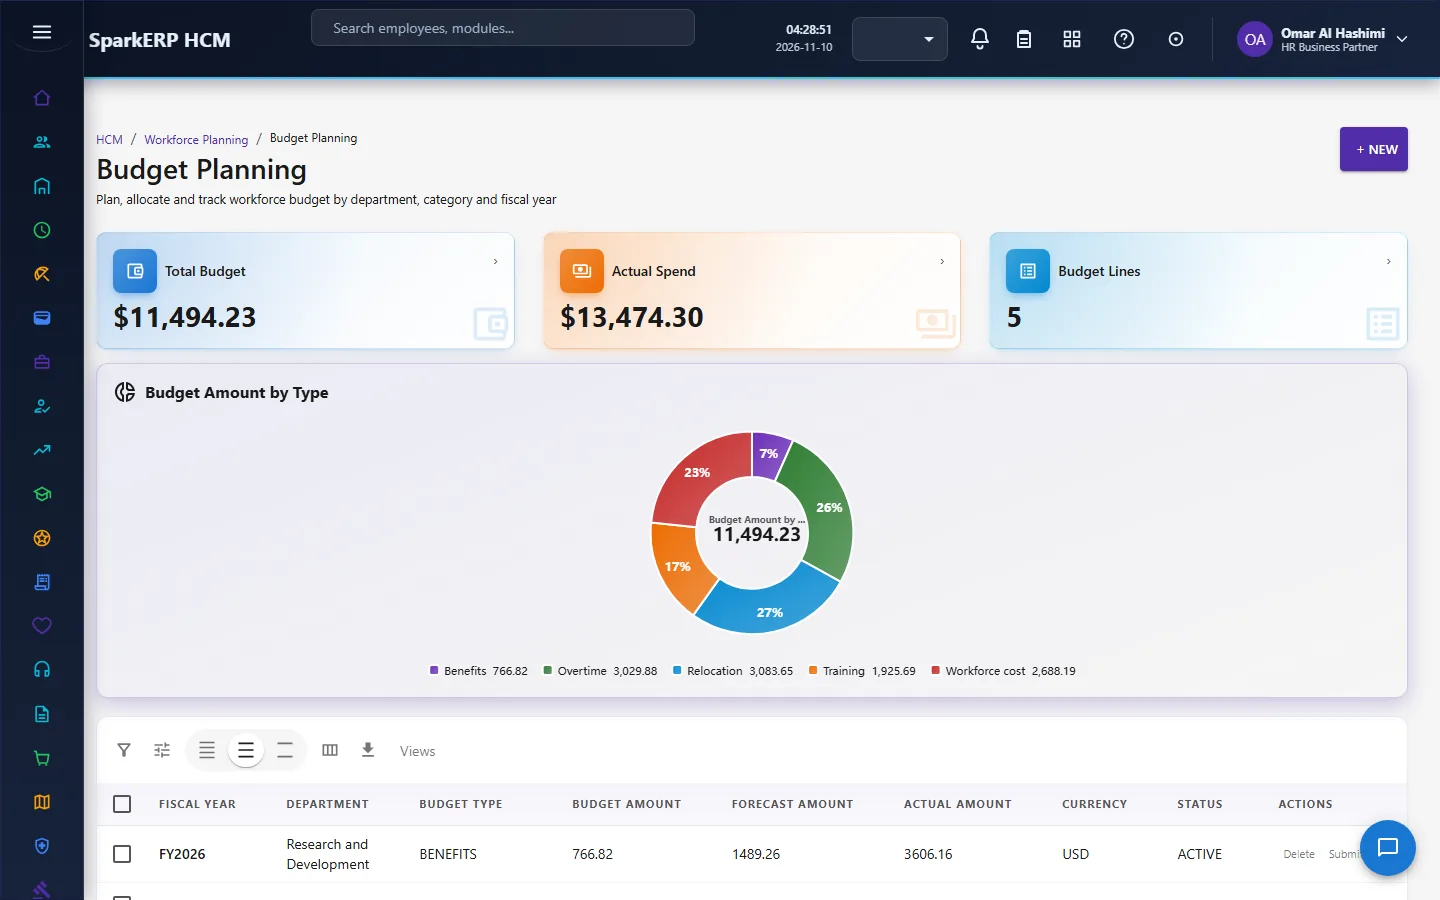
- Plans the budget for people by department, with a forecast and the actual spend.
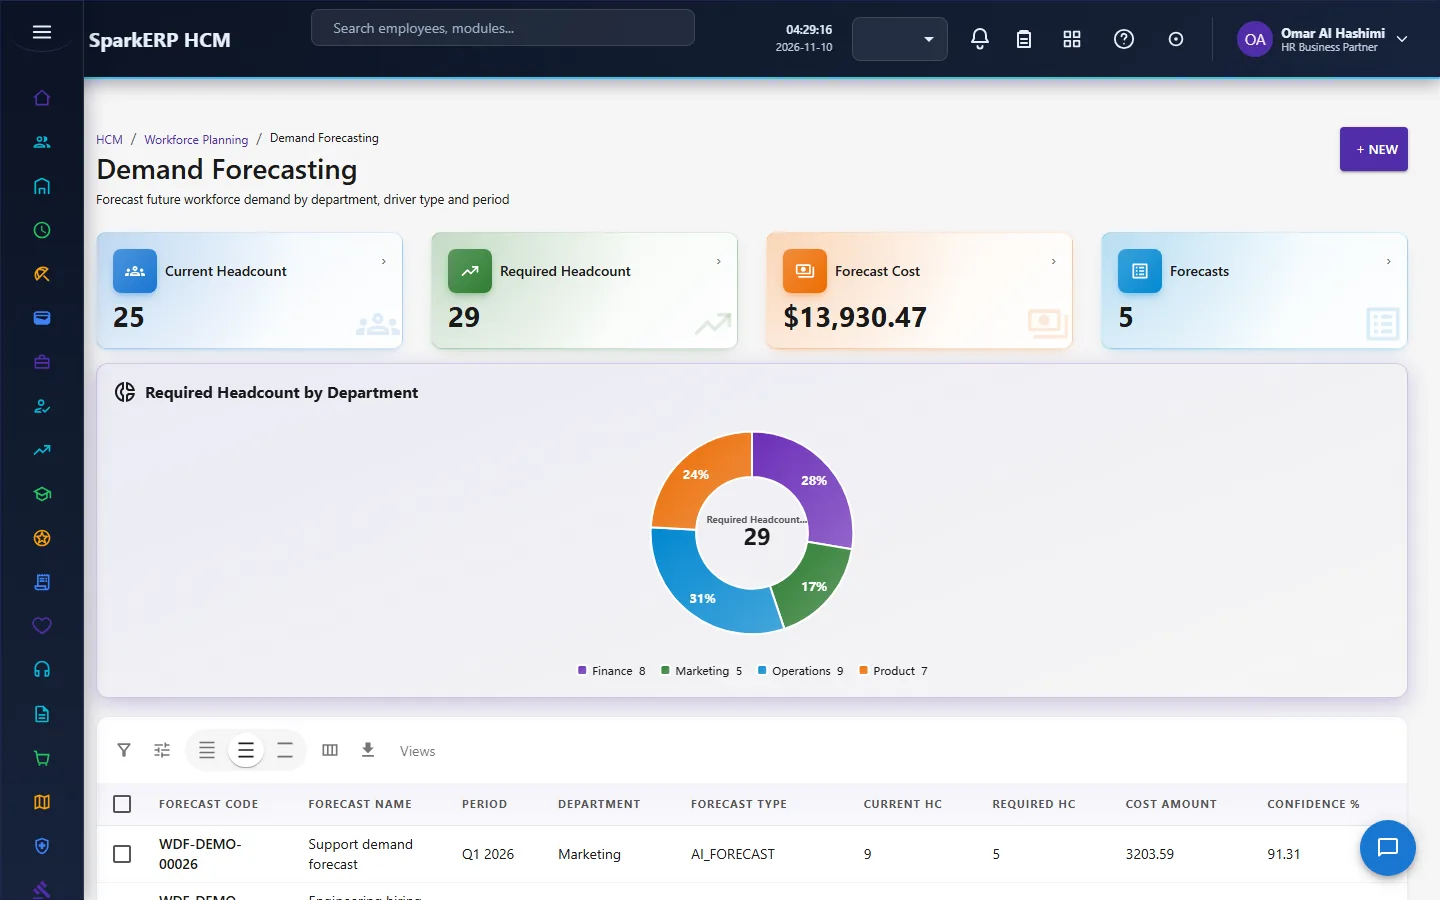
- Forecasts demand for people, with a growth rate and a suggested headcount.
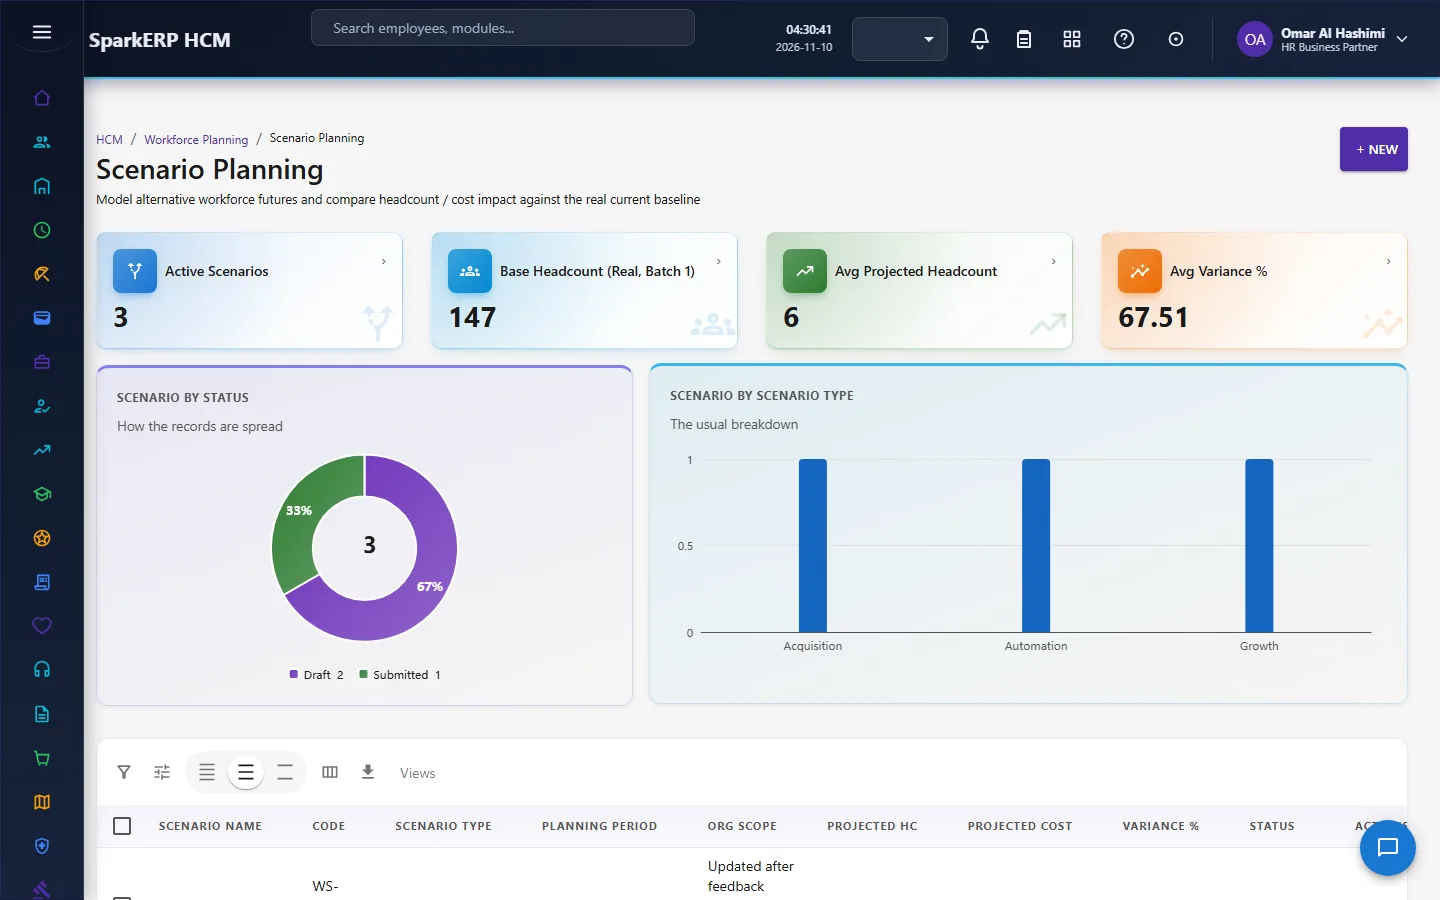
- Compares scenarios (a base case, a faster-growth case, a cost-cutting case) side by side.
- Finds skill gaps by department and job family, with a severity.
- Checks the plan against reality. Monthly snapshots of actual headcount show how accurate the forecast was.
- Projects supply month by month from attrition, hires and internal moves.
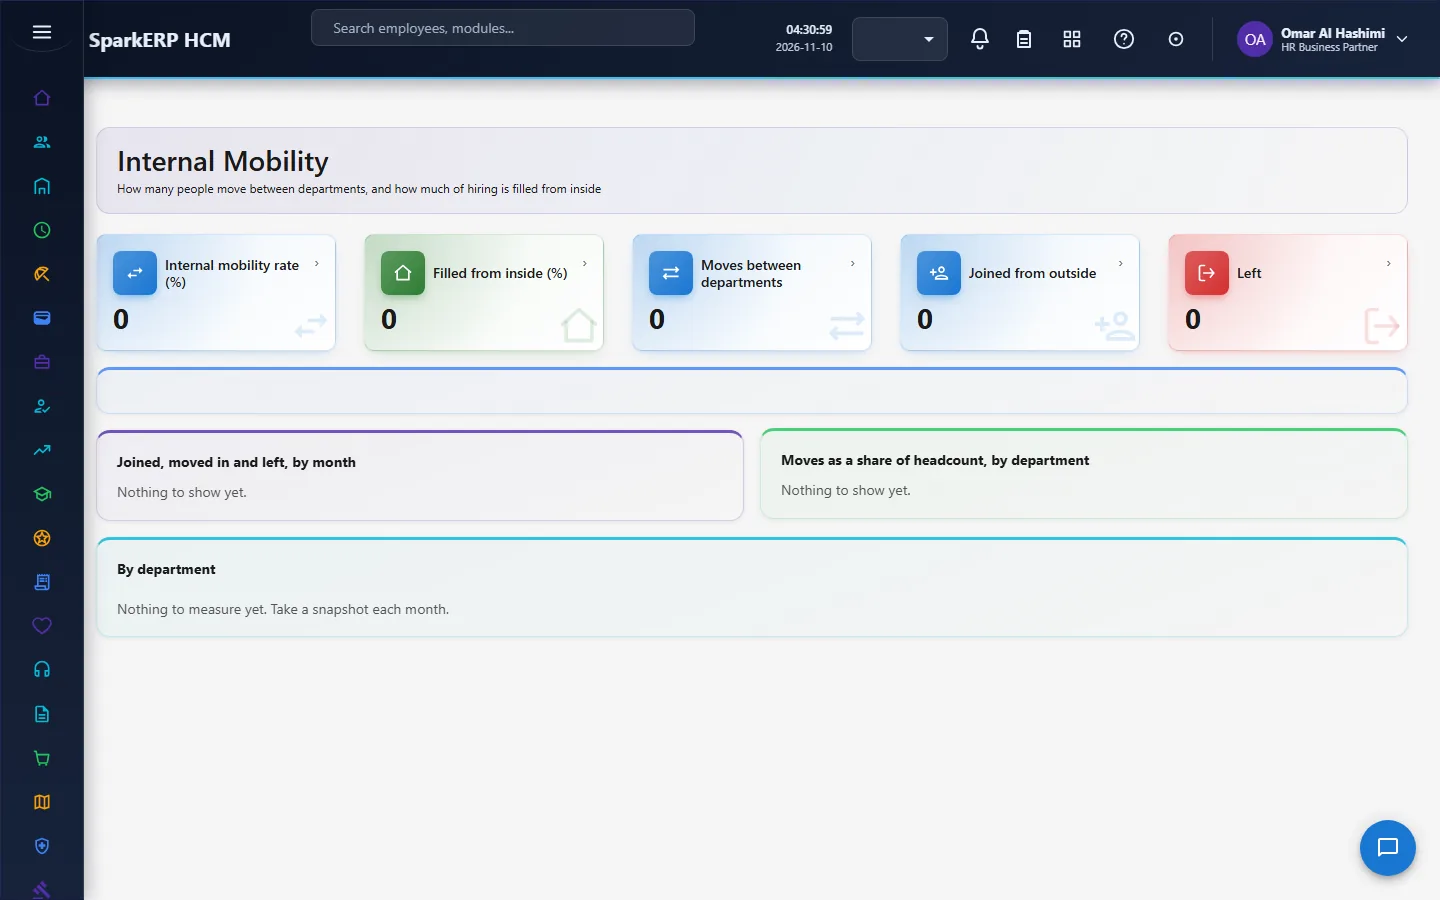
- Measures internal mobility. How many people move between departments and how many roles are filled from inside.
What it does not do: it does not hire, cut or move anyone. It is the plan and the measures. Approved plans guide the Recruitment and Core HR work, but nothing here changes a position or opens a requisition by itself.
2. How workforce planning works, end to end
2.1 The planning cycle
- Take stock. Capture the actual headcount (a monthly snapshot).
- Forecast demand for each department.
- Plan headcount and budget for the year, department by department, in a scenario.
- Compare scenarios and choose one.
- Approve the plan.
- Execute outside the module through requisitions, transfers and positions.
- Check accuracy each month against the snapshots, and project supply forward.
2.2 Headcount plans
A headcount plan has a fiscal year, a department (an organization unit), a scenario type, the current headcount, the planned headcount, the planned hiring, the planned reduction, the estimated cost and the currency, and a status. A plan goes through an approval, a review task due within three days, decided by the Workforce Planning Administrator or the Tenant Owner.
2.3 Budget planning
A budget line has a fiscal year, a department, a budget type, the budget amount, a forecast amount and the actual amount, with a status and notes. It shows how the budget compares with the forecast and with what was spent.
2.4 Demand forecasting
A demand forecast has a code and name, a period, a department, a forecast type, the current and required headcount, the cost, a confidence score and a status. The suggested headcount is worked out by the platform as the current headcount times (1 plus the growth rate percent divided by 100), and is recalculated whenever the current headcount or the growth rate changes. It is a suggestion: the required headcount is what a person decides.
2.5 Scenarios
A scenario has a name and code, a type, a planning period, a base scenario it is compared with, an organization scope, the projected headcount and projected cost, the variance percent from the base, the hiring required and the attrition impact, with an owner. Scenarios are how you see the cost of a decision before you make it.
2.6 Skill gap analysis
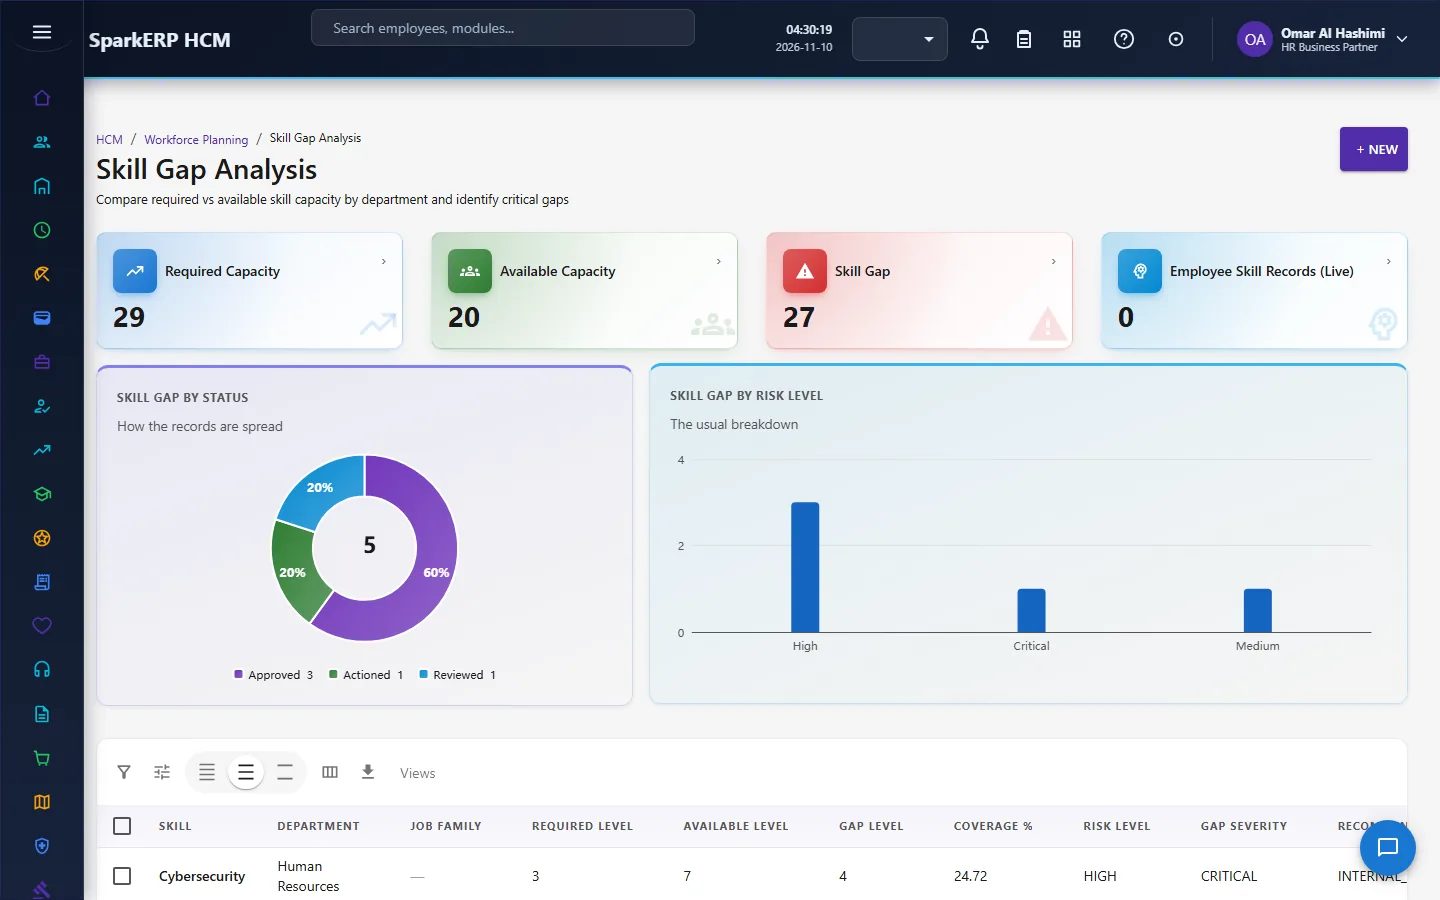
A skill gap compares what is needed with what is available, by skill, department and job family: the required and available level, the required and available capacity, and the gap. The platform works out the gap ratio (the gap capacity as a percent of the required capacity) and its severity:
| Gap ratio | Severity |
|---|---|
| Under 20% | Low |
| 20% to under 50% | Moderate |
| 50% or more | Critical |
The record also keeps the coverage percentage, a risk level and a recommended action.
2.7 Headcount snapshots
The plan holds targets, but "was the plan right" needs the actual headcount at points in time, which the HR record does not keep. So the module keeps its own monthly snapshots: one row per department and month with the headcount, the joiners, the leavers and the transfers in and out. To tell a leaver from a transfer exactly, it keeps the list of people in each snapshot.
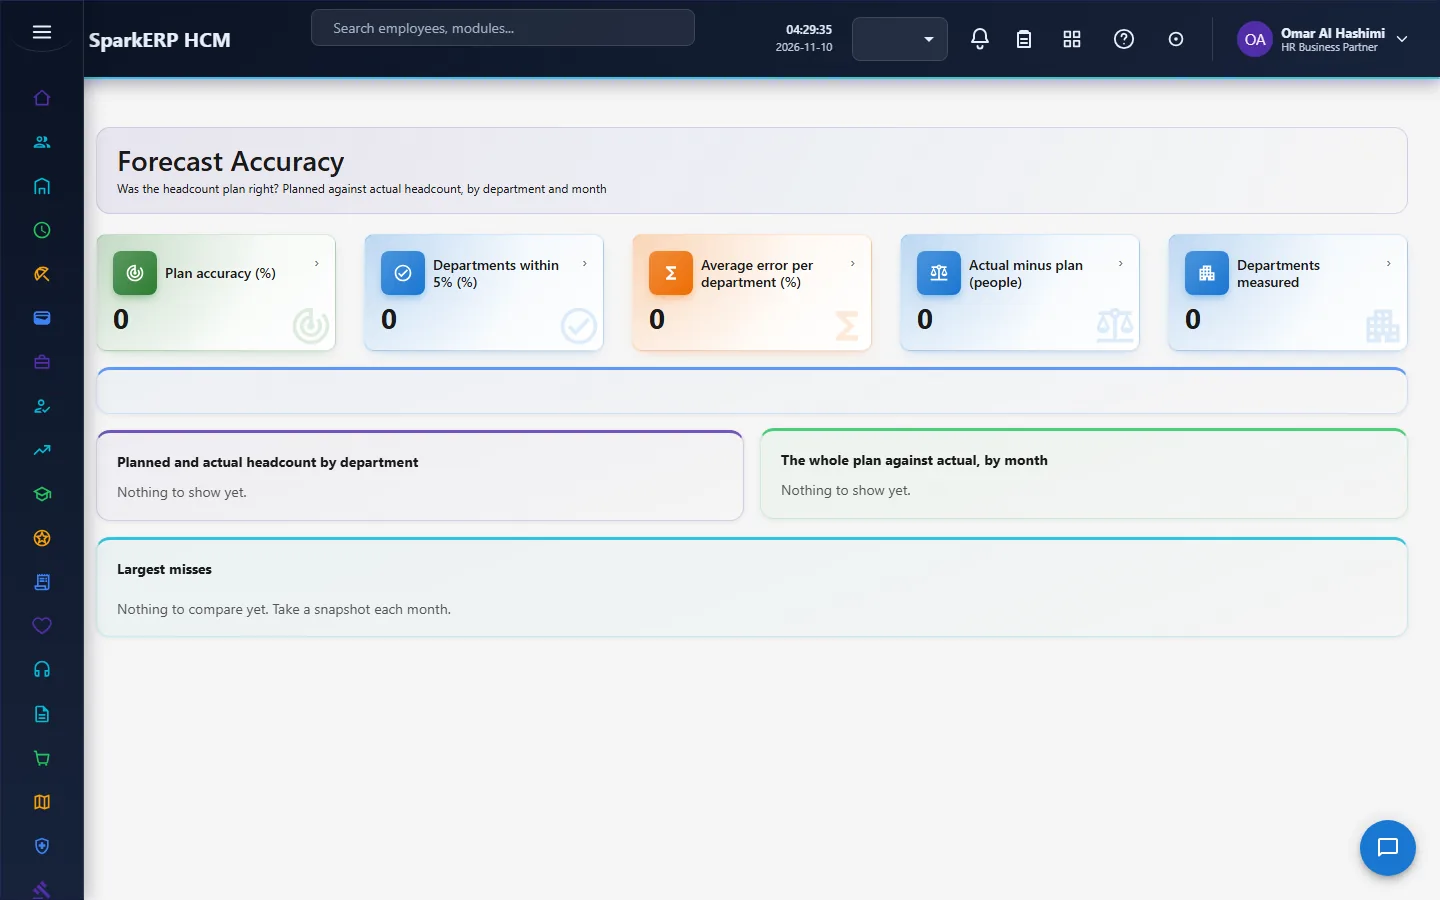
A snapshot is taken by an administrator from the Forecast Accuracy page, once a month. There is no automatic job yet. The joiners come from the hire dates; the leavers and transfers come from comparing with the previous snapshot.
2.8 Forecast accuracy
The definitions are written down because no standard defines a headcount forecast error:
- Error of a forecast = actual minus planned. Error rate = the size of the error divided by the actual.
- WAPE = the sum of the errors' sizes divided by the sum of the actuals. It is not thrown off by a small department.
- Accuracy = 100 minus WAPE, never below 0.
- "Within 5%" = the share of departments whose error rate is at most 5 percent.
- The planned path from the headcount at the start of the year to the approved year-end target is a straight line, because the plan holds only the target and not a month-by-month schedule.
2.9 Supply projection
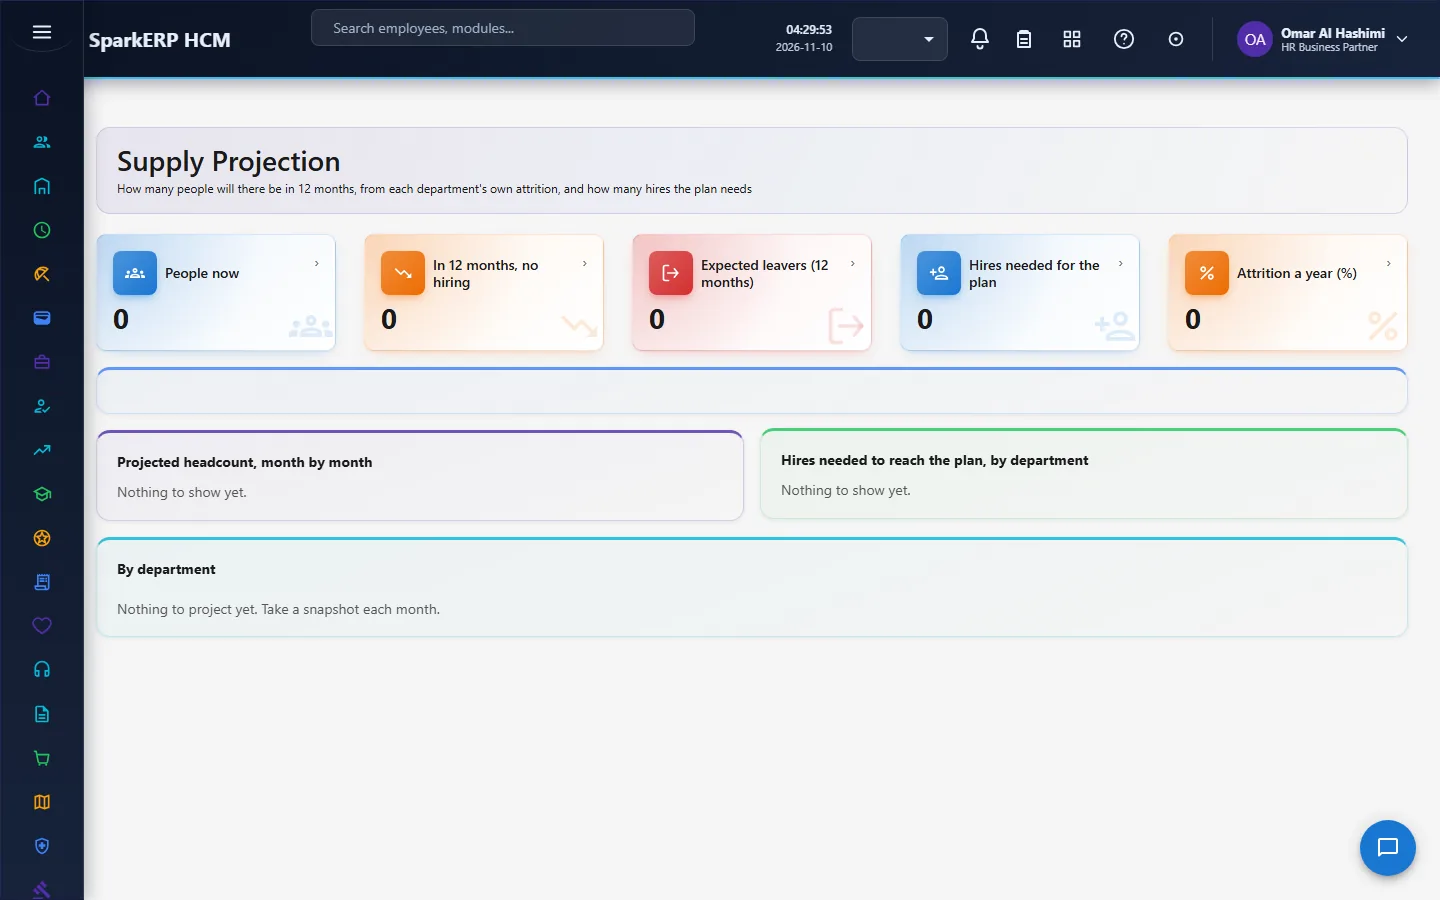
For one month ahead: next month's headcount = headcount × (1 − the monthly attrition rate) + the planned hires per month + the average net internal moves.
Attrition is the department's own rate from its snapshots (the leavers over the average headcount), not one blended rate. Internal moves are a loss in the sending department and a gain in the receiving one, so they are never counted twice. Retirements are not projected, because that would need an age for every person, which is a sensitive attribute; leavers already include them.
2.10 Internal mobility
- Internal mobility rate = the moves between departments in 12 months, divided by the average headcount.
- Internal fill rate = the internal moves into departments, divided by the internal moves plus the external joiners.
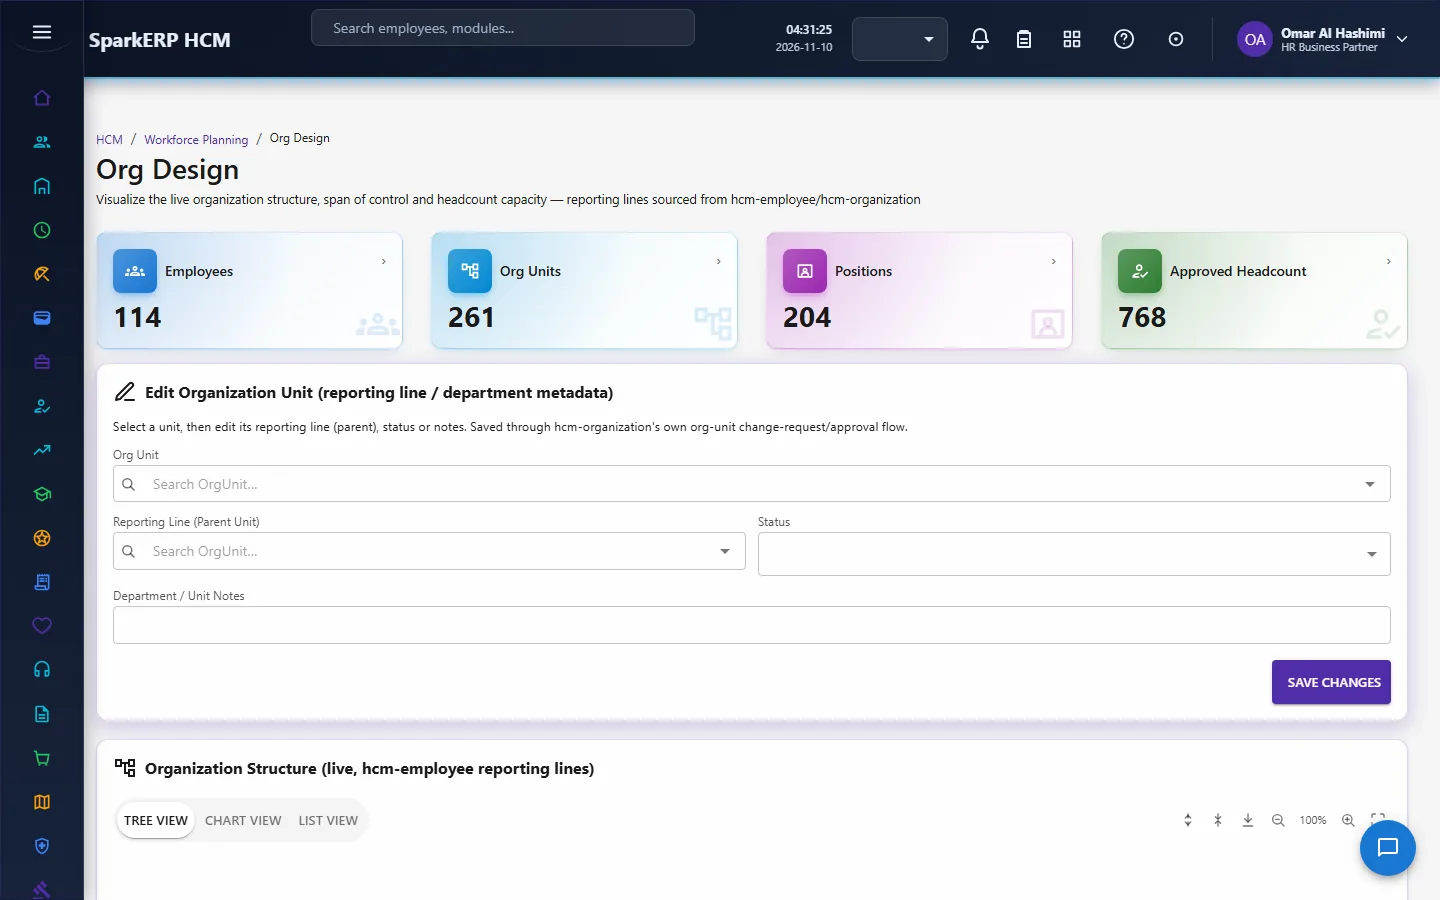
2.11 Org design and insights
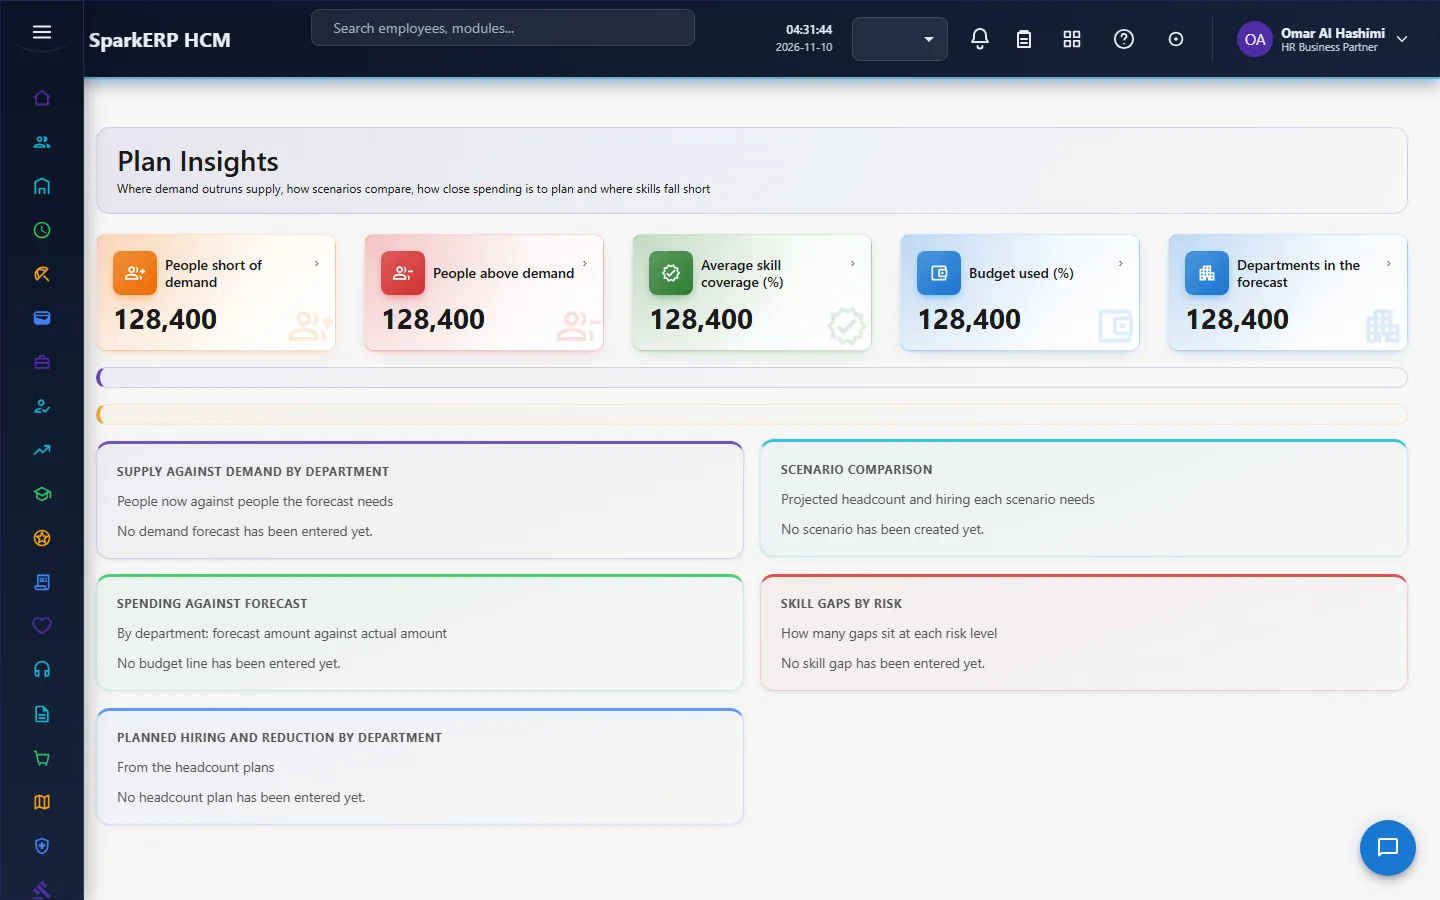
Org Design shows the structure for planning. Plan Insights answers four questions in one call: the supply and demand gap by department, the scenario comparison, the budget against the forecast and the skill coverage by risk.
3. Who does what
| Role | What they do |
|---|---|
| Workforce Planning Administrator | Builds plans, budgets, forecasts and scenarios; decides the plan approvals; captures the monthly snapshot. |
| Workforce Planning Viewer | Reads every planning screen. |
| Tenant Owner | Can decide the approval. |
| HR roles and the analytics viewer | Read the planning screens and reports. |
The planning screens show headcount and cost for the whole organization, so they are open to the planning roles, HR, the analytics viewer and the auditor. They are not open to employees or to line managers without one of those roles.
3a. What each role sees, screen by screen
The employee
An employee has no Workforce Planning screens.

The executive (reader)
The Workforce Dashboard gives the headline picture. Headcount Planning and Budget Planning hold the plan.
Demand Forecasting and Forecast Accuracy look forward and check back.
Supply Projection, Skill Gap Analysis and Scenario Planning show the options.
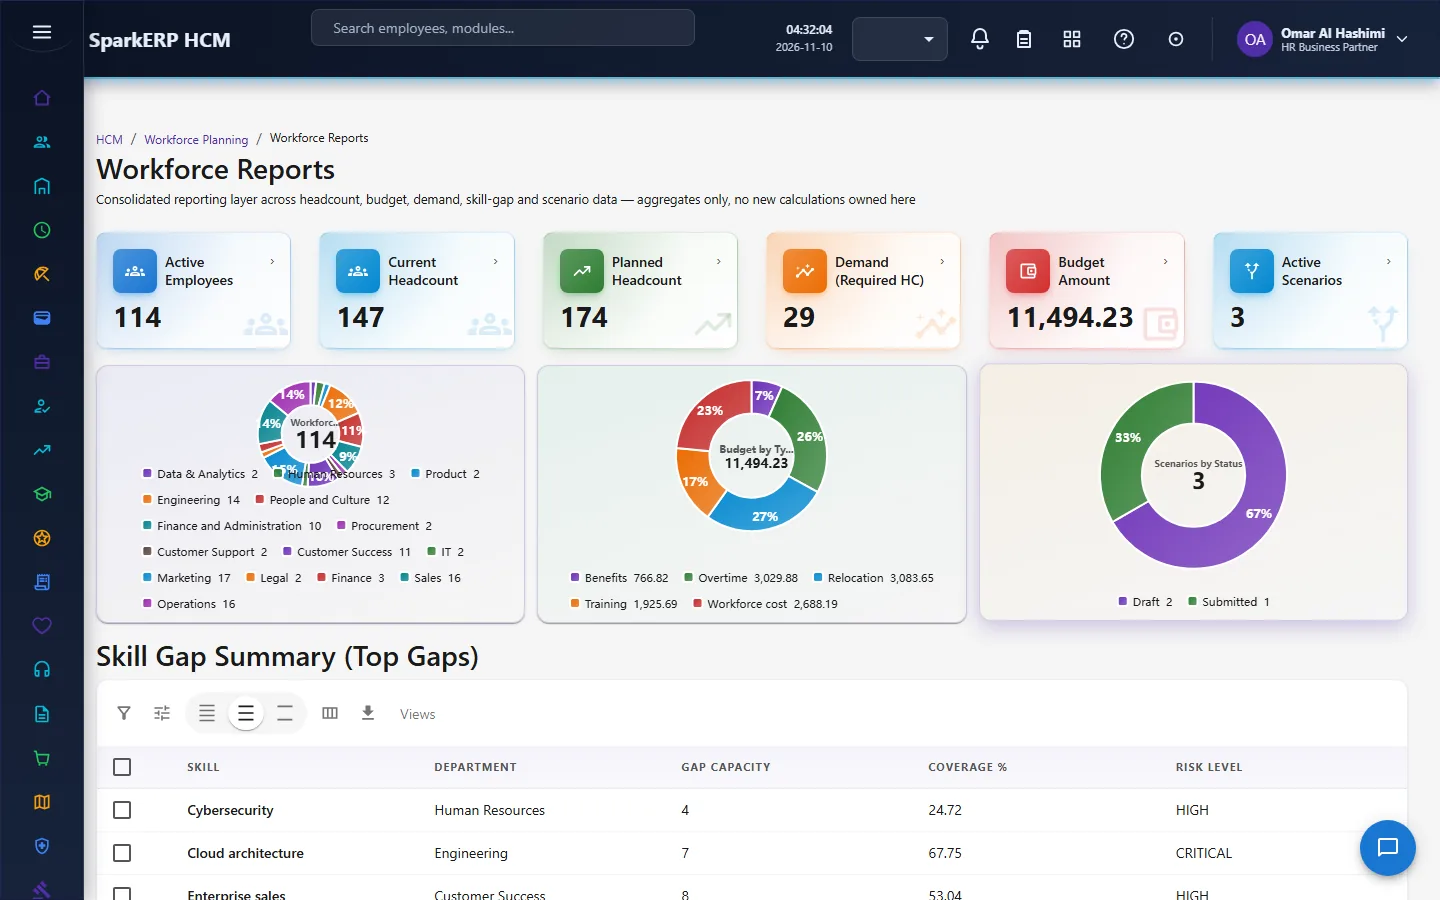
Internal Mobility, Org Design, Plan Insights and Workforce Reports complete it.
4. Decide before you set up
| Decision | What to think about |
|---|---|
| The planning horizon | The fiscal year, and whether you plan by quarter too. |
| The unit of planning | Department, or a coarser unit. |
| Scenarios | The cases you will compare (base, growth, cost cutting). |
| Who approves the plan | The Workforce Planning Administrator, and who else may. |
| Snapshot day | Which day of the month someone captures the snapshot. |
| Skill levels and capacity | How you measure required and available skills. |
5. Set up step by step
- Roles. Give the Workforce Planning Administrator and Viewer roles.
- Organization. Make sure the departments exist in Organization, because plans are per department.
- First snapshot. On Forecast Accuracy, capture the first monthly snapshot, and then one each month after.
- Plans. Create the headcount plans and the budget lines for the year, by scenario.
- Forecasts and skills. Enter the demand forecasts and the skill gaps.
- Approval. Send the plan for approval.
- Trial. In a trial tenant generate the Workforce Planning demo pack and compare two scenarios.
6. Daily use
6.1 Planning the year
- Capture the latest snapshot; read the supply projection.
- Build the headcount plan and budget for each department in the base scenario.
- Build the alternatives; compare them in Scenario Planning.
- Send the chosen plan for approval.
6.2 Every month
- Capture the snapshot (it is not automatic).
- Read Forecast Accuracy: how far off was the plan?
- Read the supply projection and the skill gaps; adjust forecasts.
7. A calendar of recurring work
| When | What |
|---|---|
| Monthly | Capture the snapshot; read accuracy and supply. |
| Quarterly | Review the plan against actuals; refresh forecasts. |
| Yearly | Build and approve next year's plan. |
8. Reports and figures
Workforce Reports, Plan Insights and the dashboard show headcount, budget against forecast, scenario comparison, the supply and demand gap and skill coverage. Lists can be exported.
9. Limits you should know about
- The snapshot is manual. No automatic job takes it yet, so accuracy and supply are only as fresh as the last snapshot.
- The plan holds only the year-end target, so the planned path is a straight line.
- Retirements are not projected, to avoid using a sensitive attribute.
- Accuracy and supply need a snapshot history; the first months have little to compare.
- The module plans; it does not hire.
10. Troubleshooting
| Symptom | Cause and fix |
|---|---|
| Forecast Accuracy is empty | No snapshot has been captured yet. |
| Supply projection looks flat | There are too few snapshots to work out attrition for the department. |
| The suggested headcount did not change | The current headcount or the growth rate is missing. |
| A skill gap shows the wrong severity | Severity is set by the gap ratio: under 20% low, 20% to under 50% moderate, 50% or more critical. |
| A plan is stuck | It is waiting for the review task of the Workforce Planning Administrator or the Tenant Owner. |
| An employee cannot open a screen | The planning screens show the whole organization's headcount and cost. |