
Appearance
Workforce Planning (HCM): from setup to daily use
Workforce Planning answers three questions: how many people will we need, can we afford them, and do they have the skills? It holds the headcount plan, the demand forecast, scenarios, budget lines, skill gaps and the organisation design, and puts them side by side.
1. Who uses it
| Role | What they do |
|---|---|
| HR planner | Builds headcount plans, forecasts and scenarios, reads the gaps. |
| Finance partner | Maintains budget lines and compares forecast with actual spend. |
| Department head | Reviews the plan for their department and agrees the numbers. |
| Executive | Reads the dashboard and compares scenarios. |
2. Before you start
- Installed plugins.
hcm-workforce-planning(needs HCM Foundation). Free tier. - Org units and positions come from Core HR; the dashboard counts them.
- Trial data. In a trial tenant, generate the Workforce planning pack in Demo Data (plans, forecasts, scenarios, budget lines, skill gaps).
3. Set up
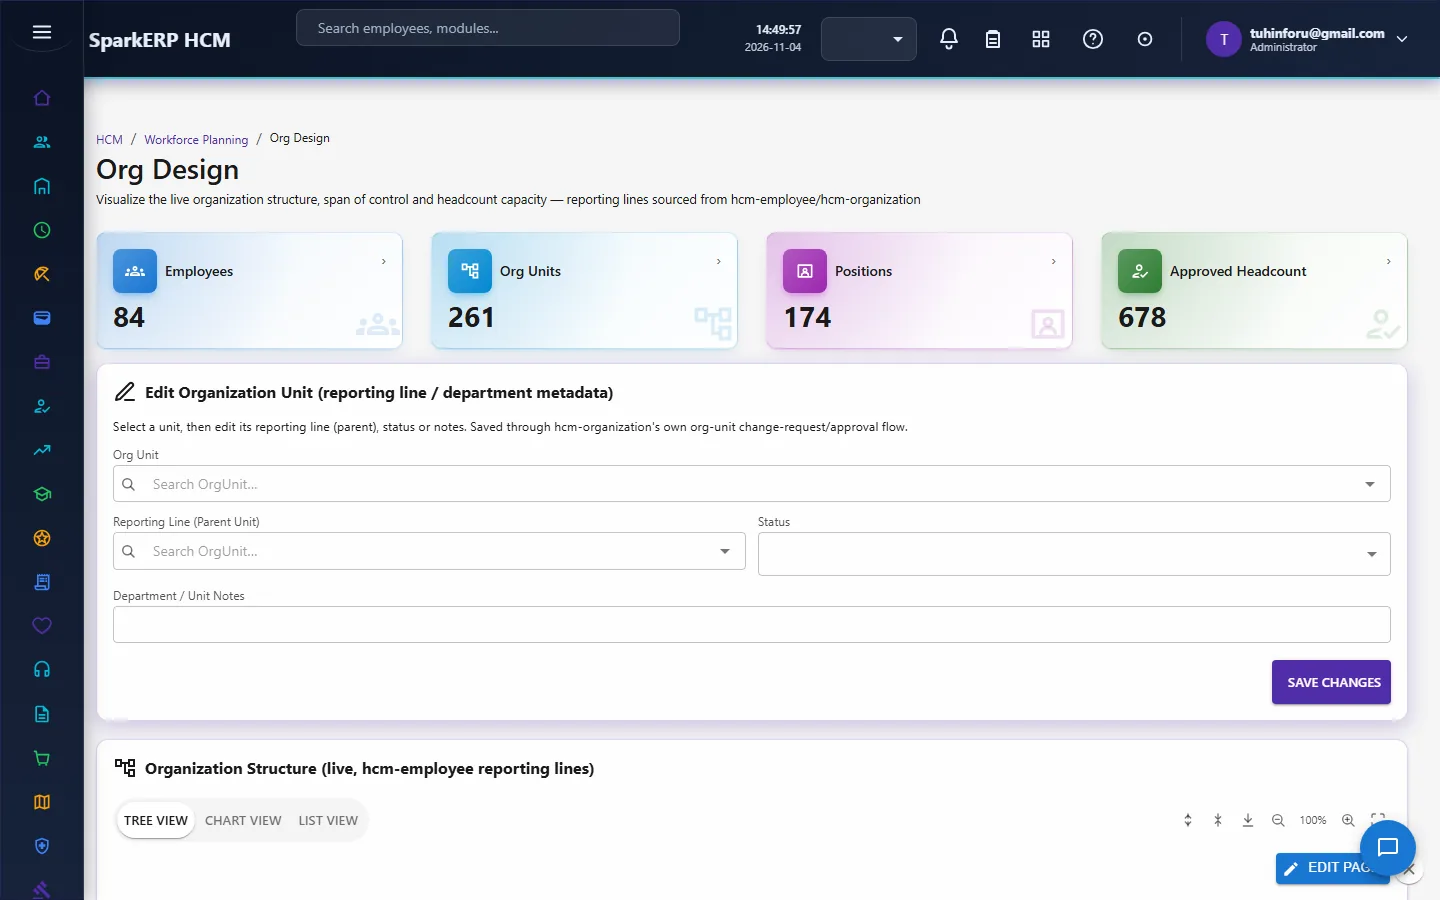
Check the organisation in Org Design (units and positions), because plans are made per department.
Choose the planning period (fiscal year) and the currency you plan in.
4. Daily use
4.1 Plan headcount
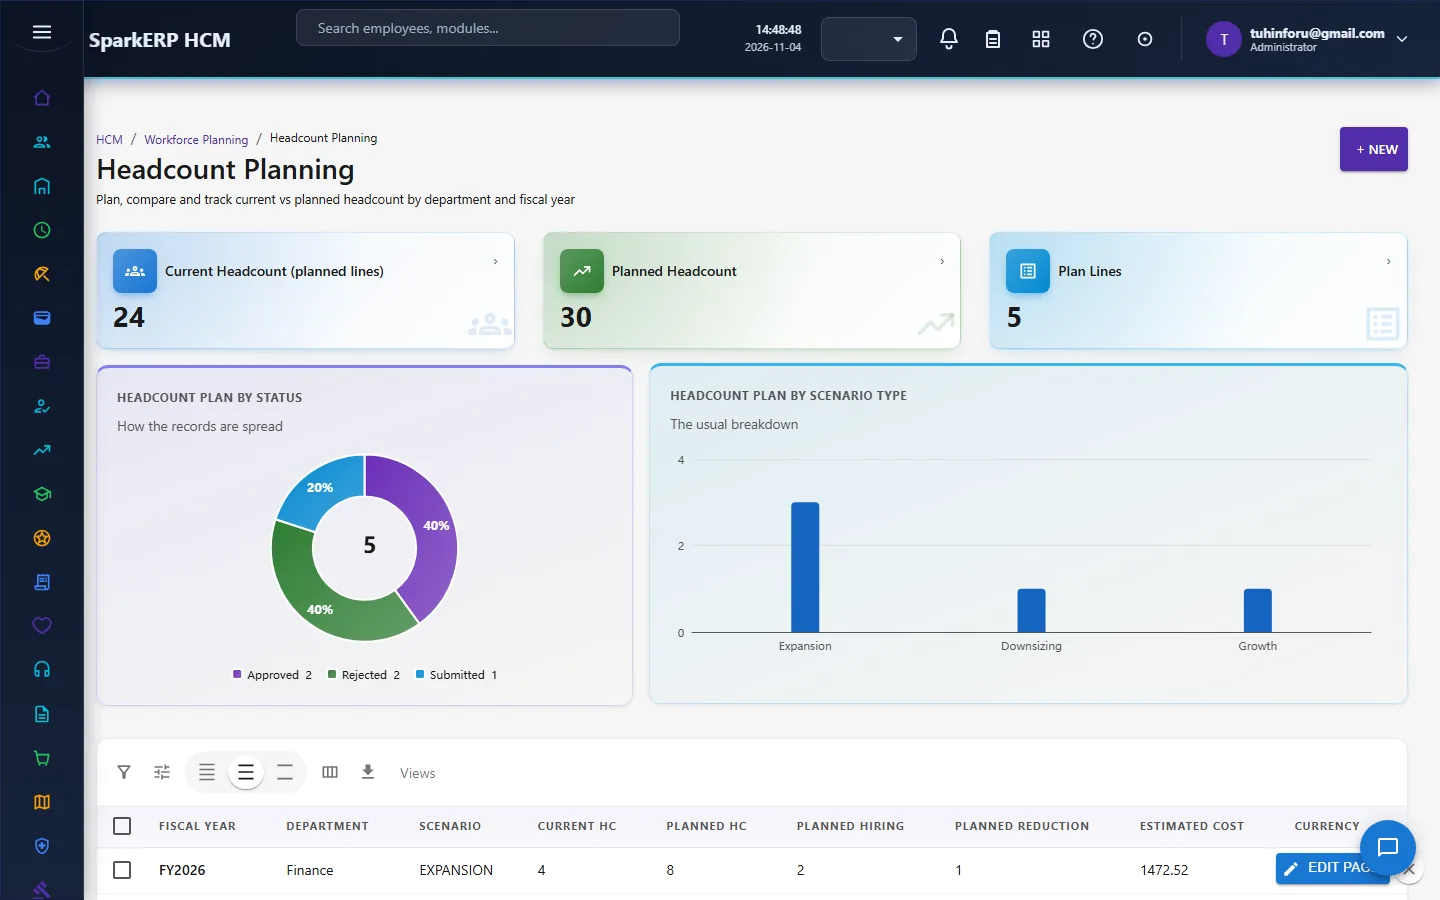
Headcount Planning: per department and fiscal year, current headcount, planned headcount, planned hiring and planned reduction, with the estimated cost.
4.2 Forecast demand
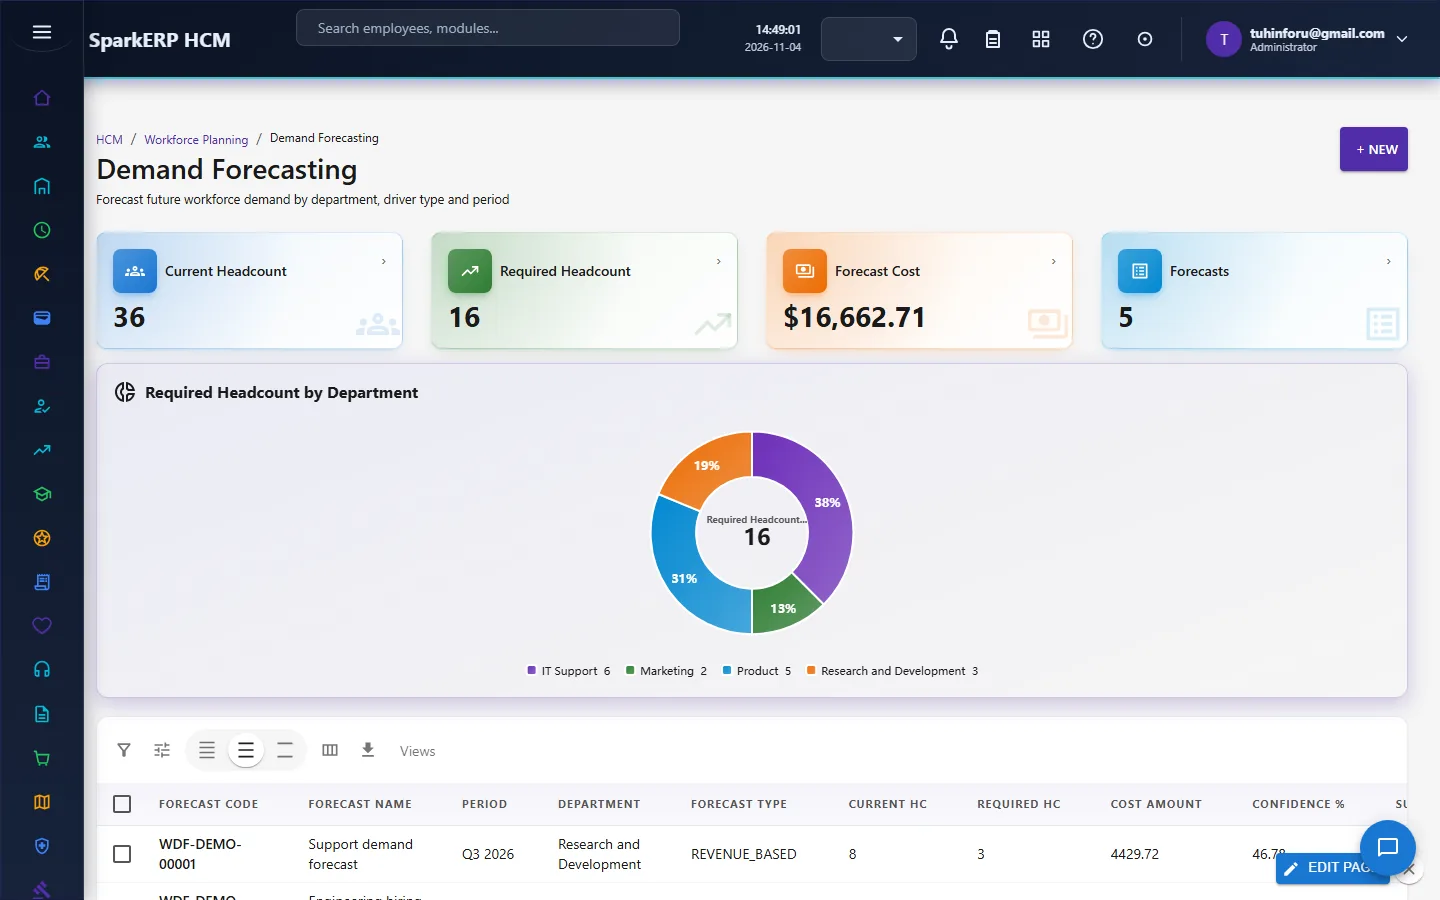
Demand Forecasting: for each department, the headcount now against the headcount the business will need, a growth rate, a confidence score and a suggested headcount.
4.3 Compare scenarios
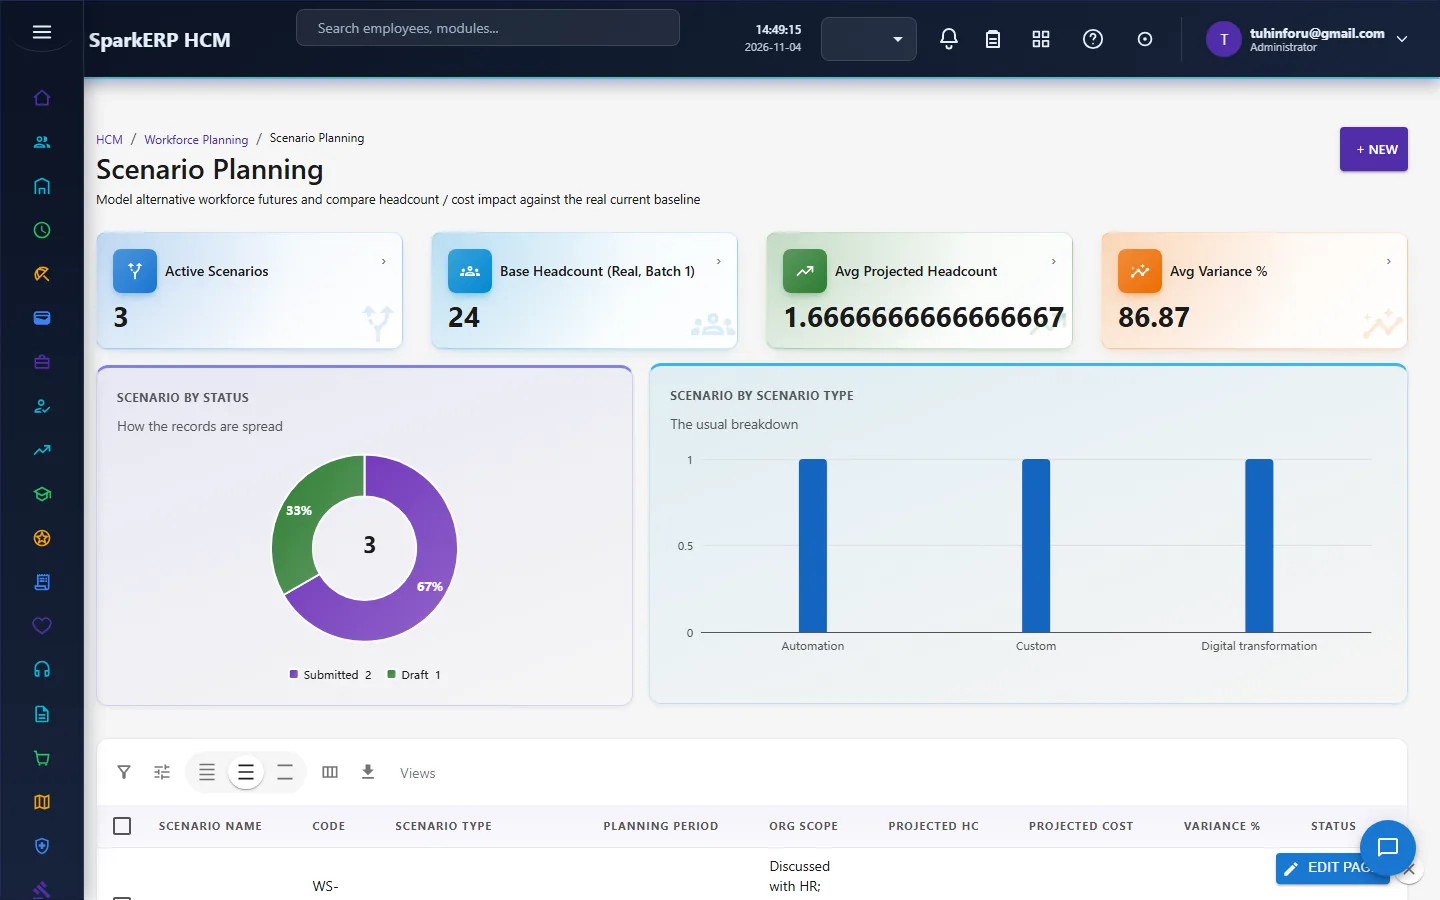
Scenario Planning: base plan, growth, cost containment and so on, each with projected headcount, projected cost, variance, hiring required and the effect of attrition.
4.4 Budget and skills
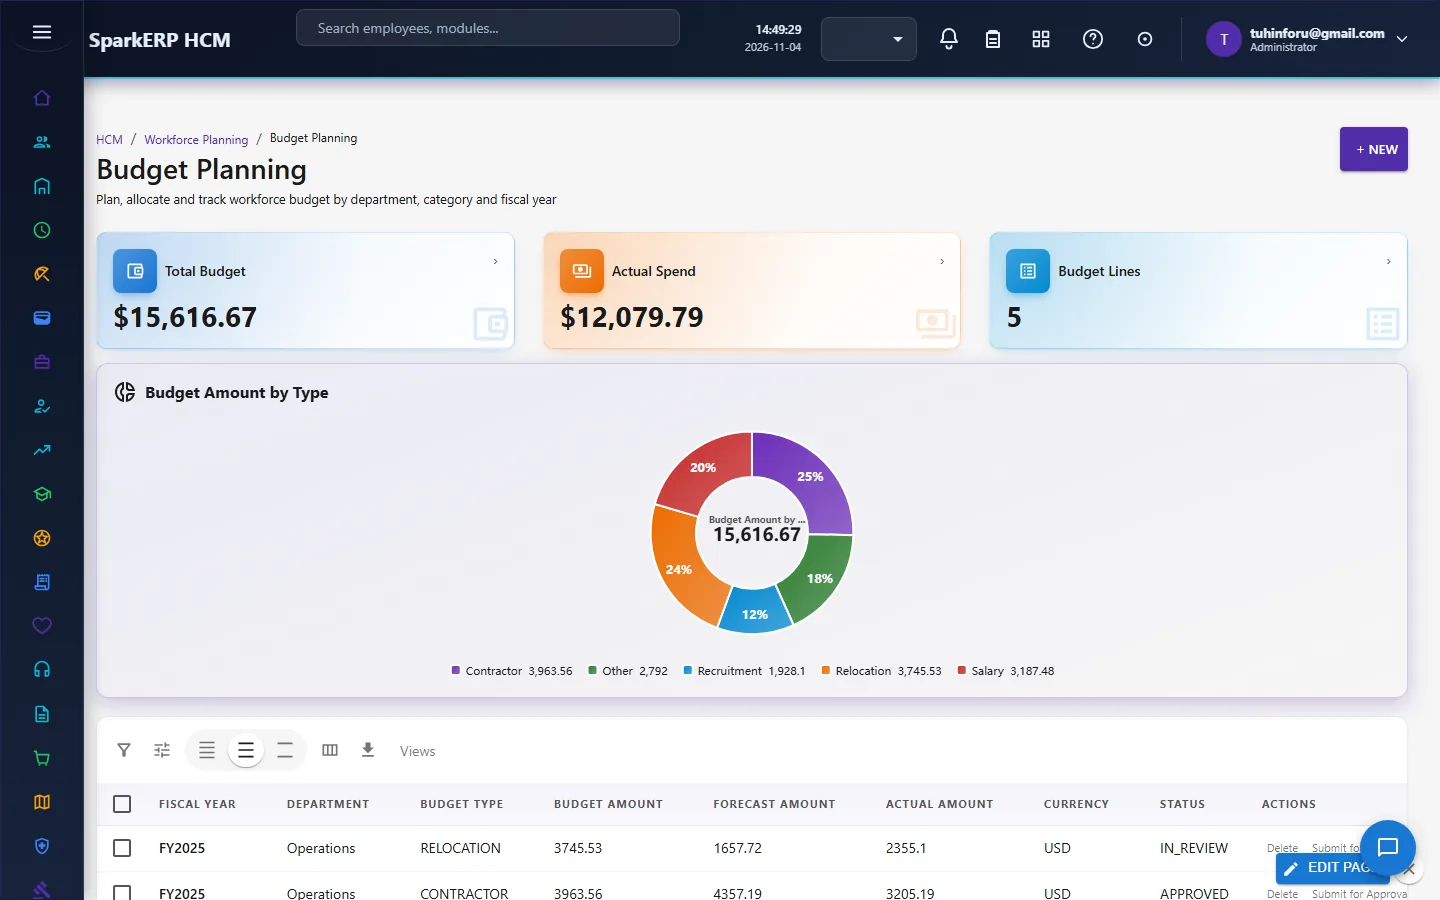
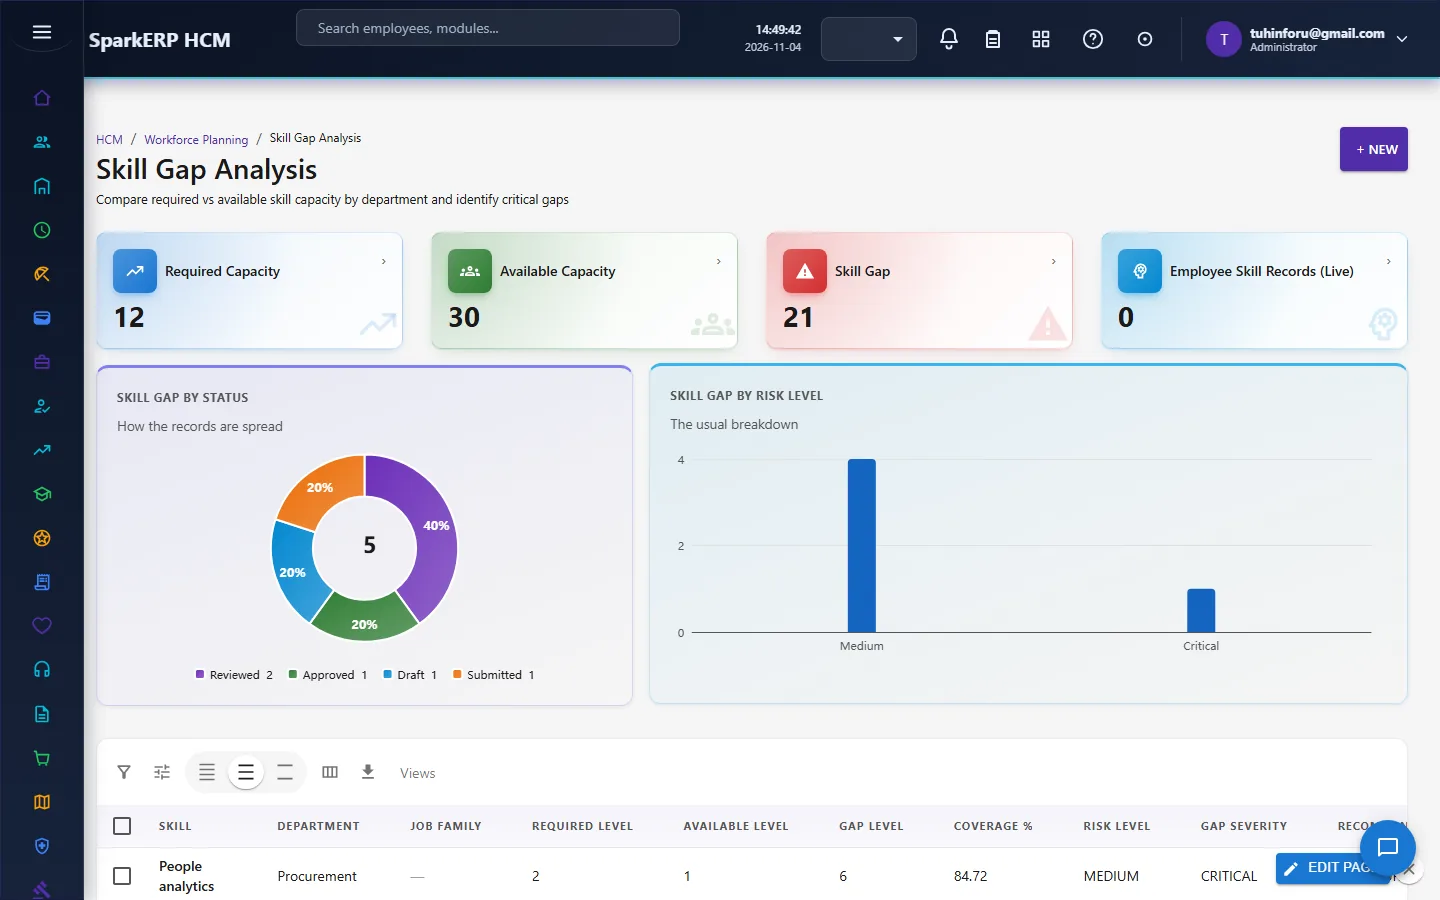
Budget Planning holds budget lines by type with forecast and actual amounts. Skill Gap Analysis compares the required and available level and capacity of a skill, with a coverage percentage and a risk level.
5. Charts and reports
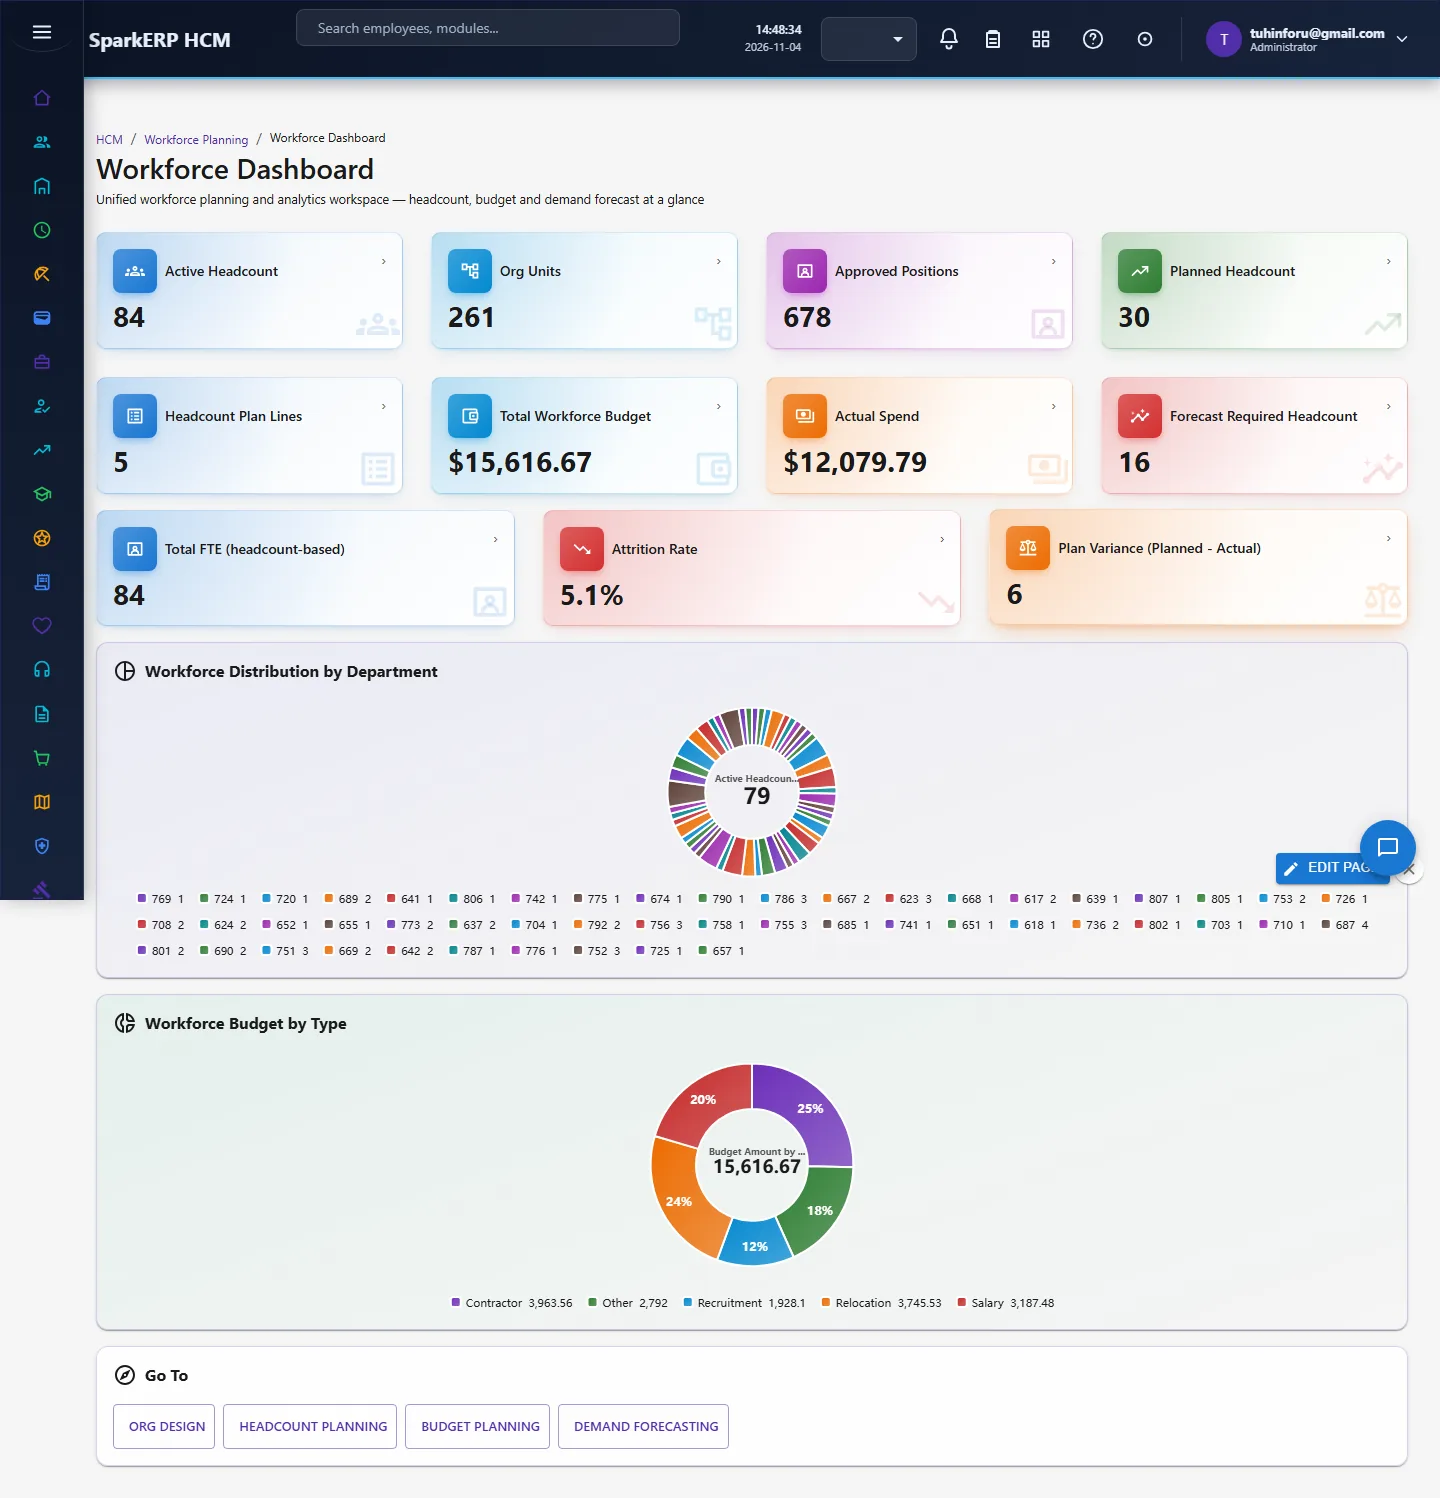
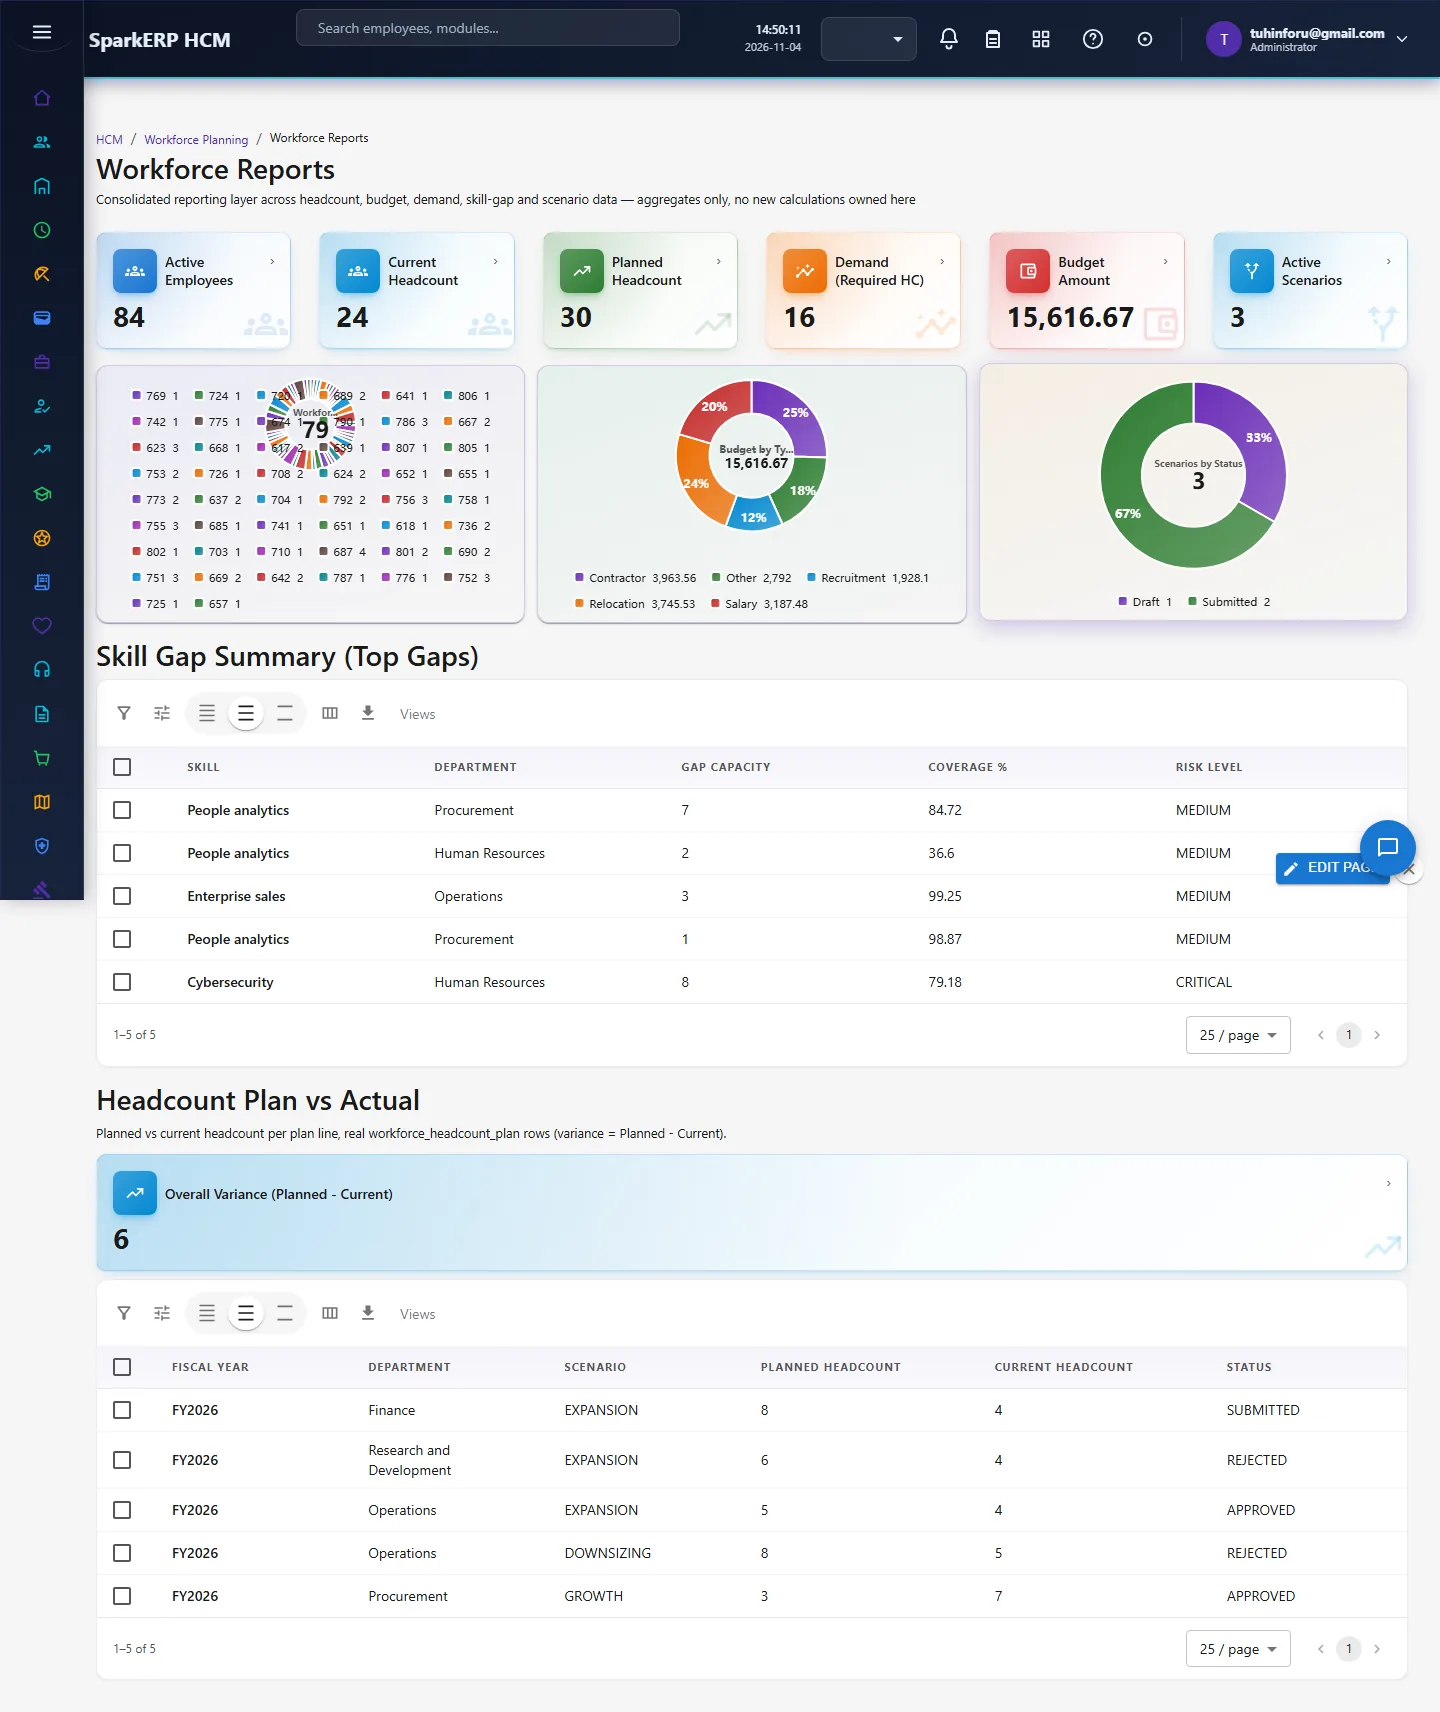
The Workforce Dashboard gives active headcount, org units, approved positions, planned headcount, budget against actual, attrition rate and plan variance, with distribution and budget charts. Workforce Reports collects the analysis.
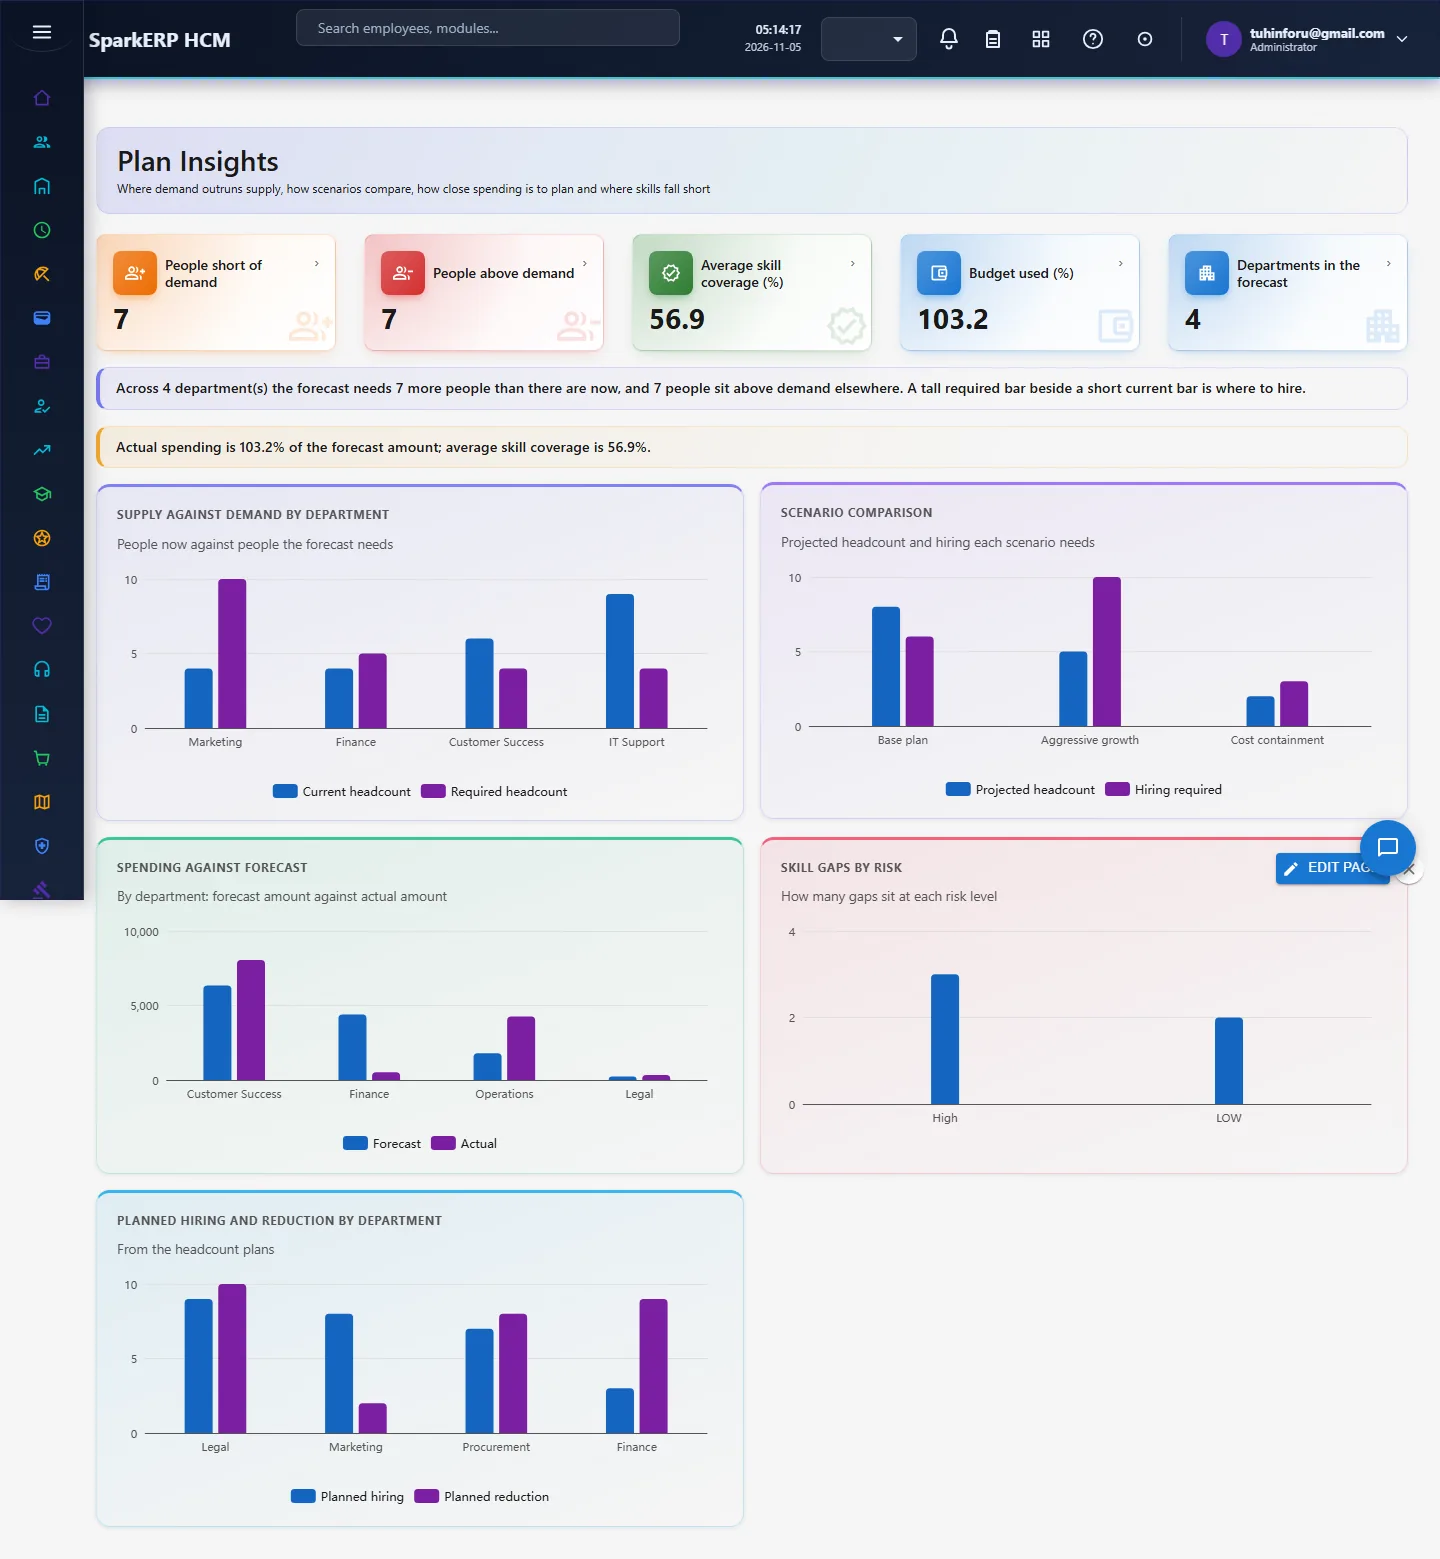
Plan Insights (new) answers the questions planners ask next: where supply falls short of demand by department, how scenarios compare on one chart, how actual spending compares with forecast, how many skill gaps sit at each risk level, and where hiring and reduction are planned.
6. On a phone or tablet
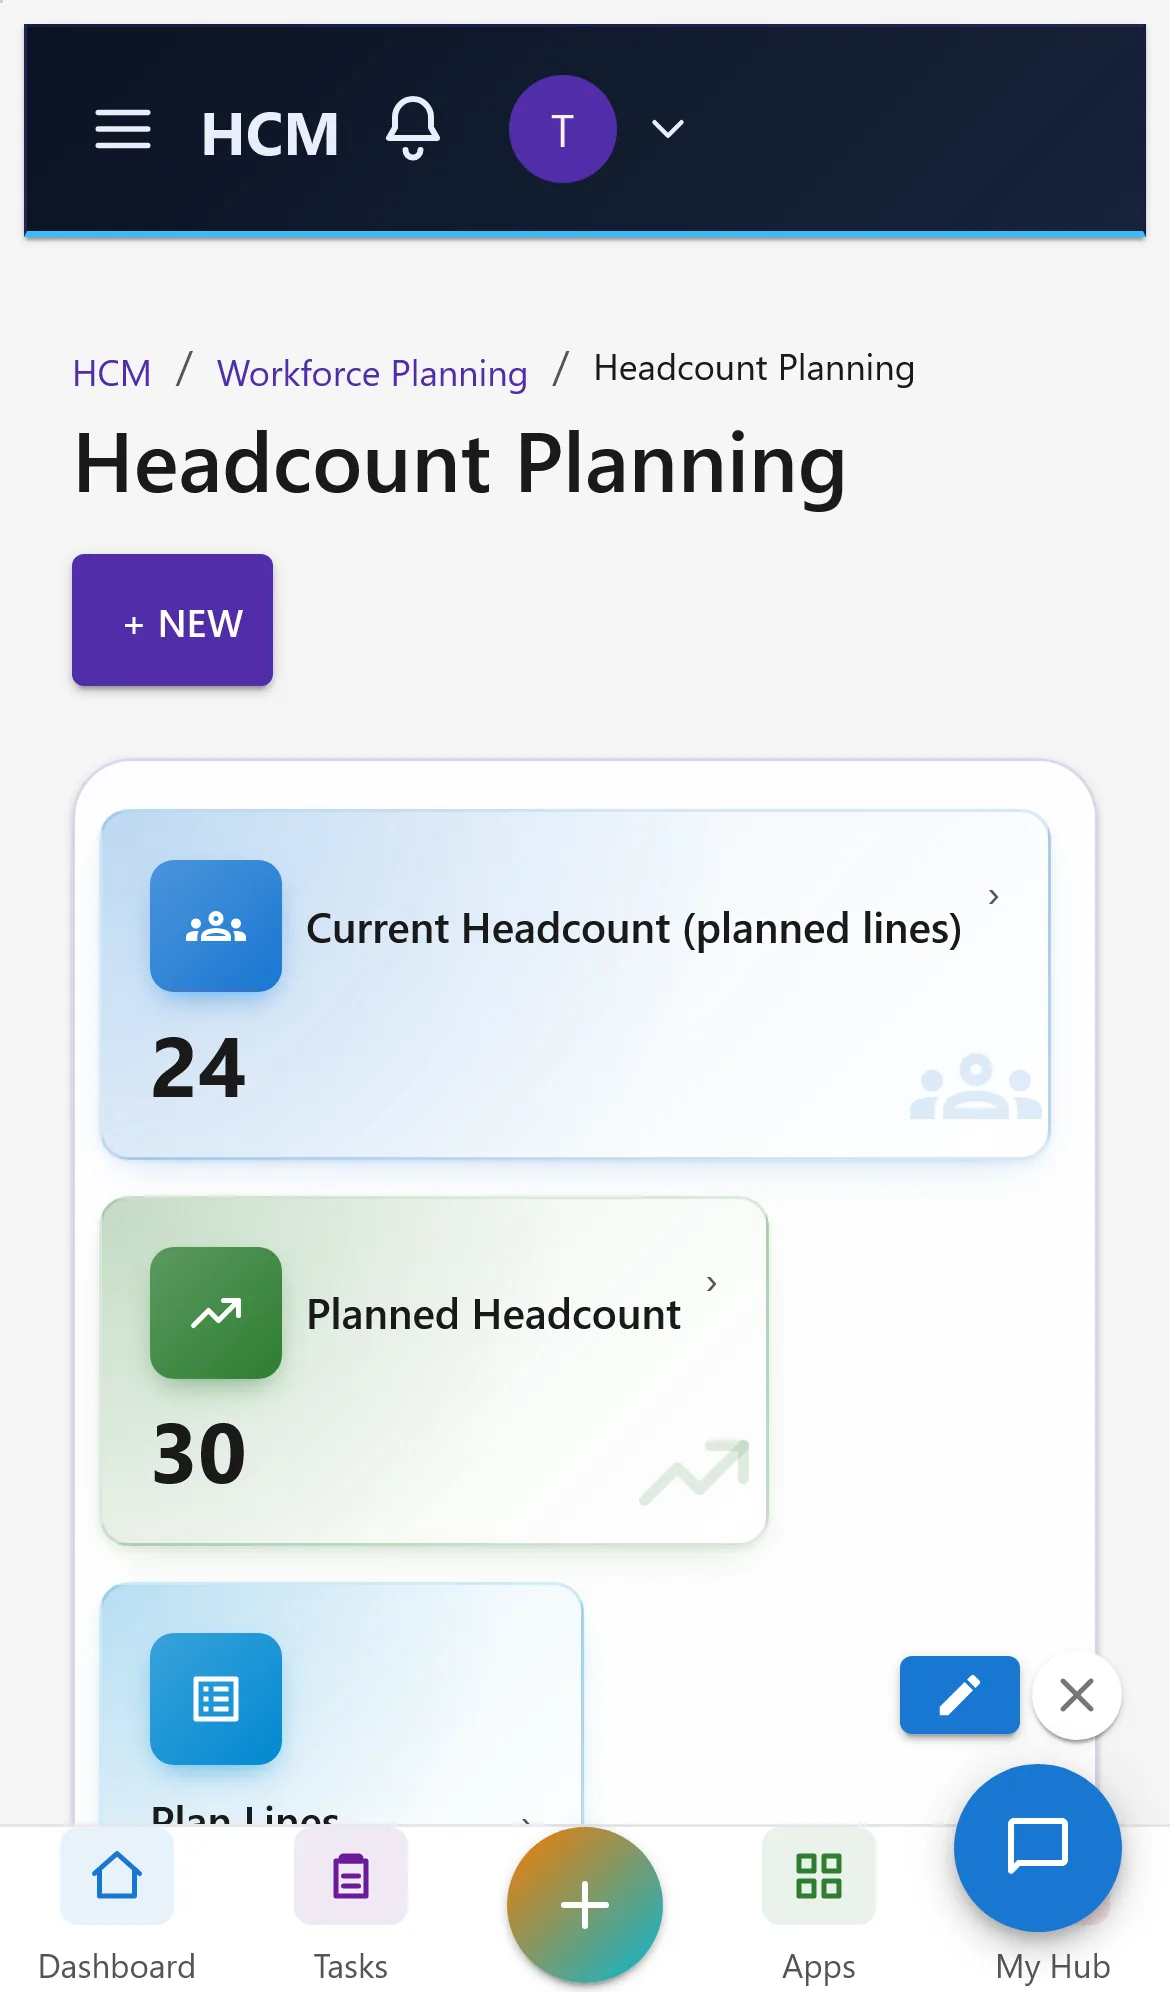
All screens open on a phone: tiles and charts stack one per row and lists scroll inside their card.
7. Rules and limits
- The gap is demand minus supply: required headcount minus current headcount; where current is higher the department counts as above demand, not as a negative gap.
- Forecast accuracy (planned against actual headcount) needs actual headcount snapshots per period; it is not built yet.
- Not built yet: attrition-driven supply projection, internal mobility rate, time to fill for critical roles.
- Known display issue: the dashboard's "Workforce Distribution by Department" donut labels departments by number.
- Demo data is small (five plan lines), so one record moves a chart a lot.
8. Troubleshooting
| Symptom | Cause and fix |
|---|---|
| Plan Insights says "Report.View is required" | The login lacks the Report view permission. |
| A chart says "Nothing to show yet" | No records of that kind. Generate the demo pack or enter data. |
| The gap reads 0 while a department looks short | Another department is above demand; the gap counts shortfalls only, the surplus is shown beside it. |
| Dashboard donut shows numbers, not names | Known display issue (see rules and limits). |