
Appearance
HCM Analytics: how it works and how to read it
HCM Analytics answers the questions leaders ask about their people: how many people do we have and how is that changing, who is leaving and when, how are attendance, leave, pay and performance doing, how is hiring going, what does the workforce cost, are we paying fairly, and how do people feel. It is a set of dashboards over the live HR data, and a report builder for your own questions. This guide explains how the module works, what each measure means exactly, and what each person sees. Every dashboard has its own page in the Analytics section; this guide is the one to read first.
1. What Analytics does for your business
- Shows the live picture. Every figure is counted from the HR records at the moment you open the page. There is no overnight copy to be stale.
- Covers each area: headcount, attrition, attendance, leave, payroll, workforce cost, compensation, performance, recruitment, training, diversity and inclusion, and employee productivity.
- Compares with before. Many measures show the last 30 days against the 30 days before, so a change is visible.
- Protects people. Anything that could identify a small group is left out.
- Lets you ask your own question. The Report Builder runs ad-hoc reports on the platform's reporting framework and exports them.
What it does not do: it does not change anything. It reads. It does not forecast; the Workforce Planning module does that. And a figure is only as good as the records behind it: an employee with no department is counted as "no department", not guessed.
2. How analytics works
2.1 Live, not copied
Each chart is a data view over the HR tables, such as an active employee count grouped by department. The dashboards read the same records the HR screens show, so a number on a dashboard and the list behind it agree. A measure is either a count, a sum, an average or a ratio worked out when the page opens.
2.2 Small groups are hidden
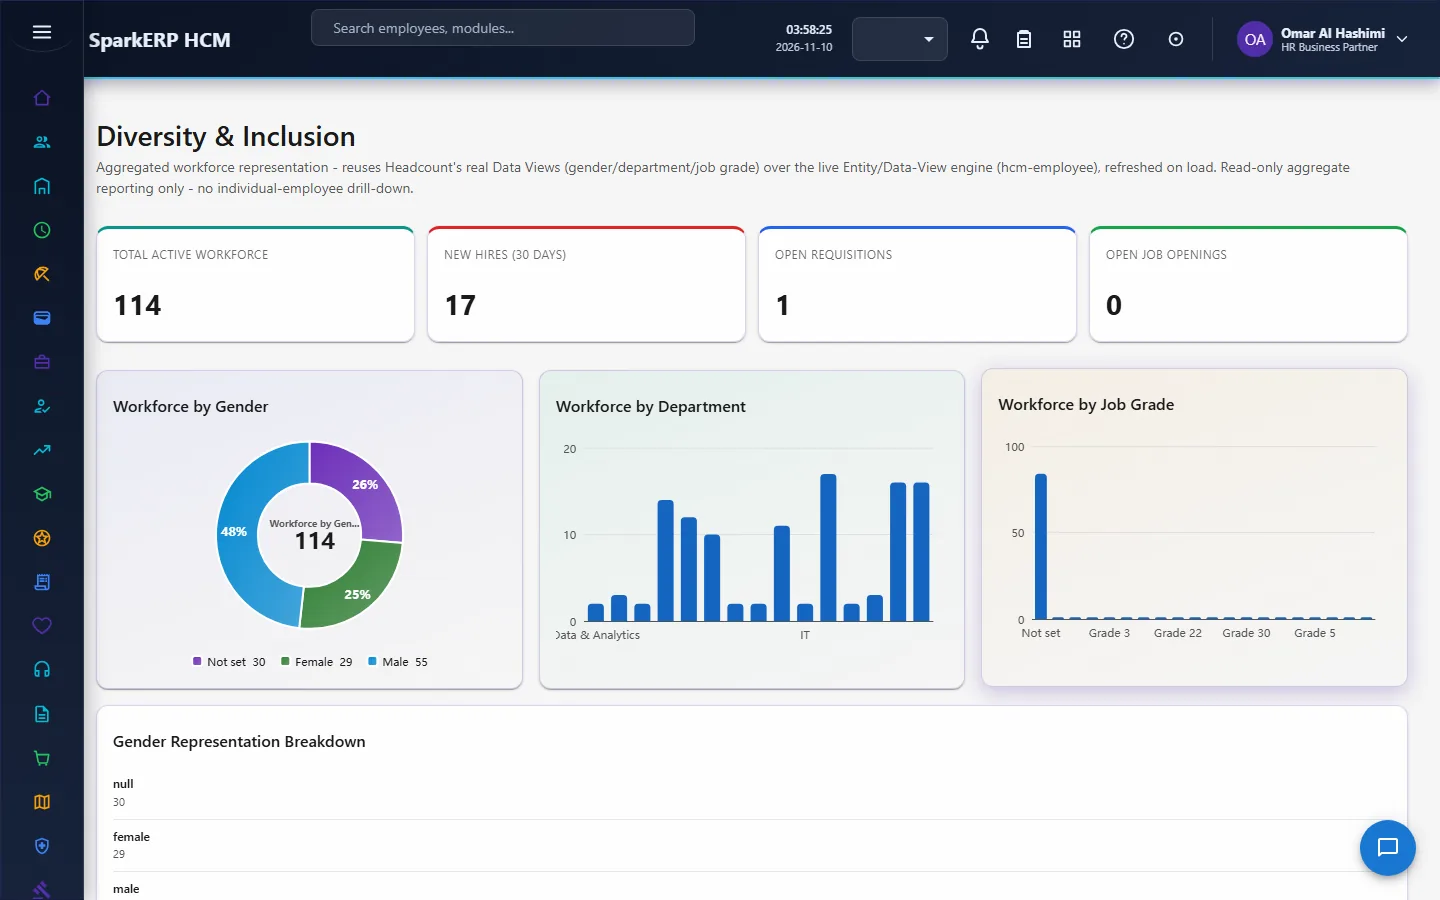
To protect privacy, a breakdown that could identify a person is left out when the group has fewer than 5 people: applications and hires by gender, the average salary by gender, the pay ratio by grade, and the gender breakdown on the Diversity & Inclusion page. A group under 5 is simply not shown.
2.3 Who may open a dashboard
Analytics shows headcount, pay and attrition for the whole organization, so it is for the HCM Analytics Administrator, the HR Analytics Viewer, the HR roles and the auditor. Each data view also carries a permission key for the area it reports on, so a person who may open the page but not read, say, payroll sees that dashboard's payroll figures refused, not shown.
3. What each measure means
3.1 Headcount and people
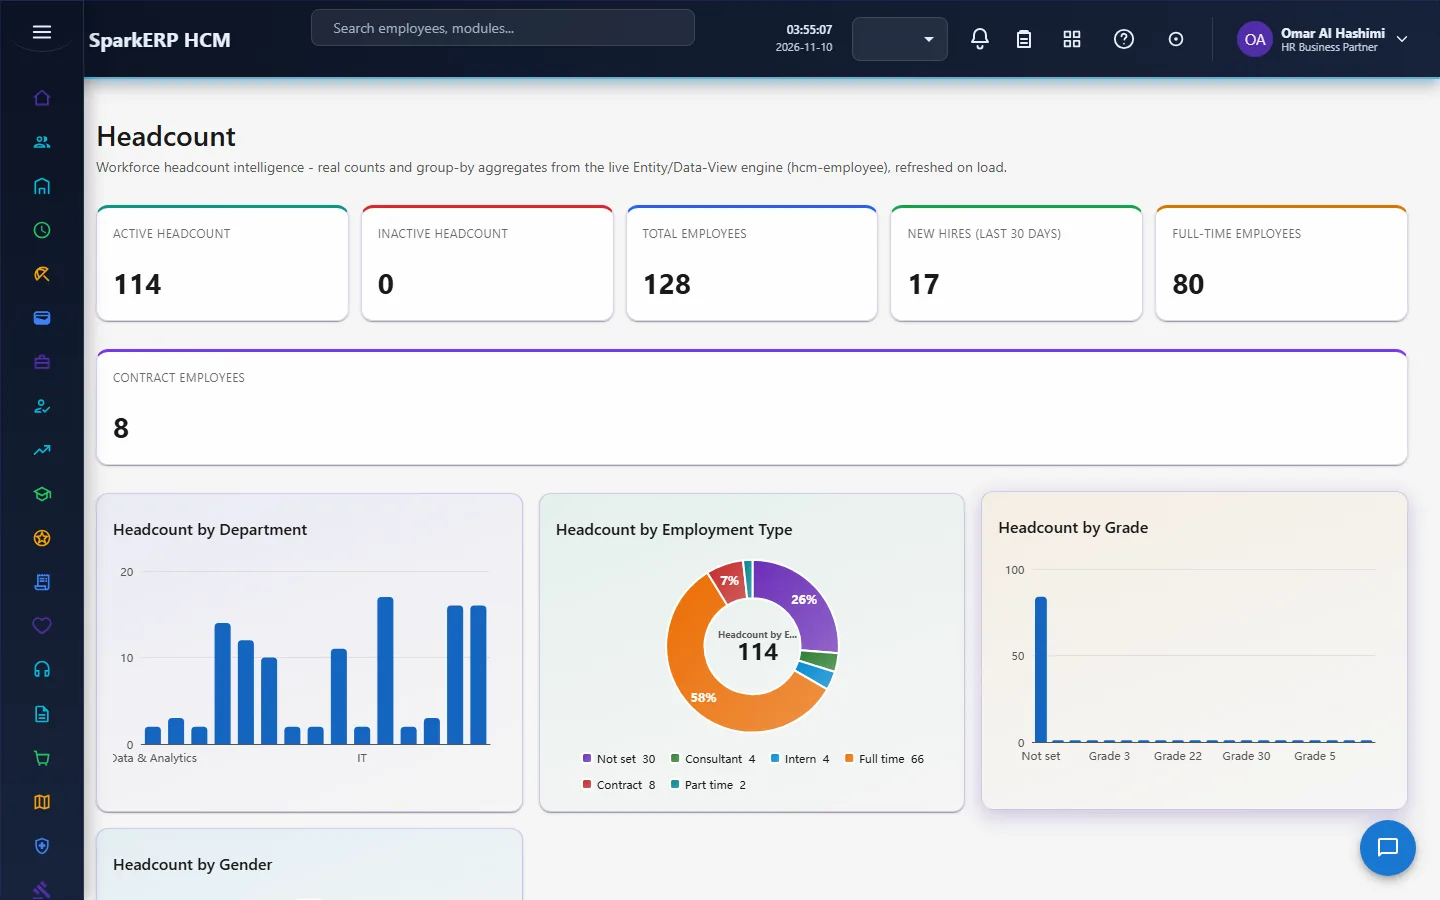
- Active headcount, total, full-time, contract, inactive: counts of employee records by status and employment type.
- Headcount by department, employment type, gender and grade: active employees grouped by the department, the employment type, the gender and the job grade of their position.
- New hires (30 days): hires dated in the last 30 days, shown against the 31 to 60 days before.
- Hires in 12 months: hires dated in the last 12 months against the 12 months before.
- Tenure: active employees with the company under 1 year, 1 to 2 years and over 2 years.
- Age bands: active employees born between two dates, one count for each band.
- Span of control: direct reports per manager, for the managers with the most people.
- Missing department: active employees with no department (a data quality check).
- Vacant and approved positions: positions marked vacant, and the total budgeted headcount of positions that are vacant or occupied.
3.2 Attrition and exits
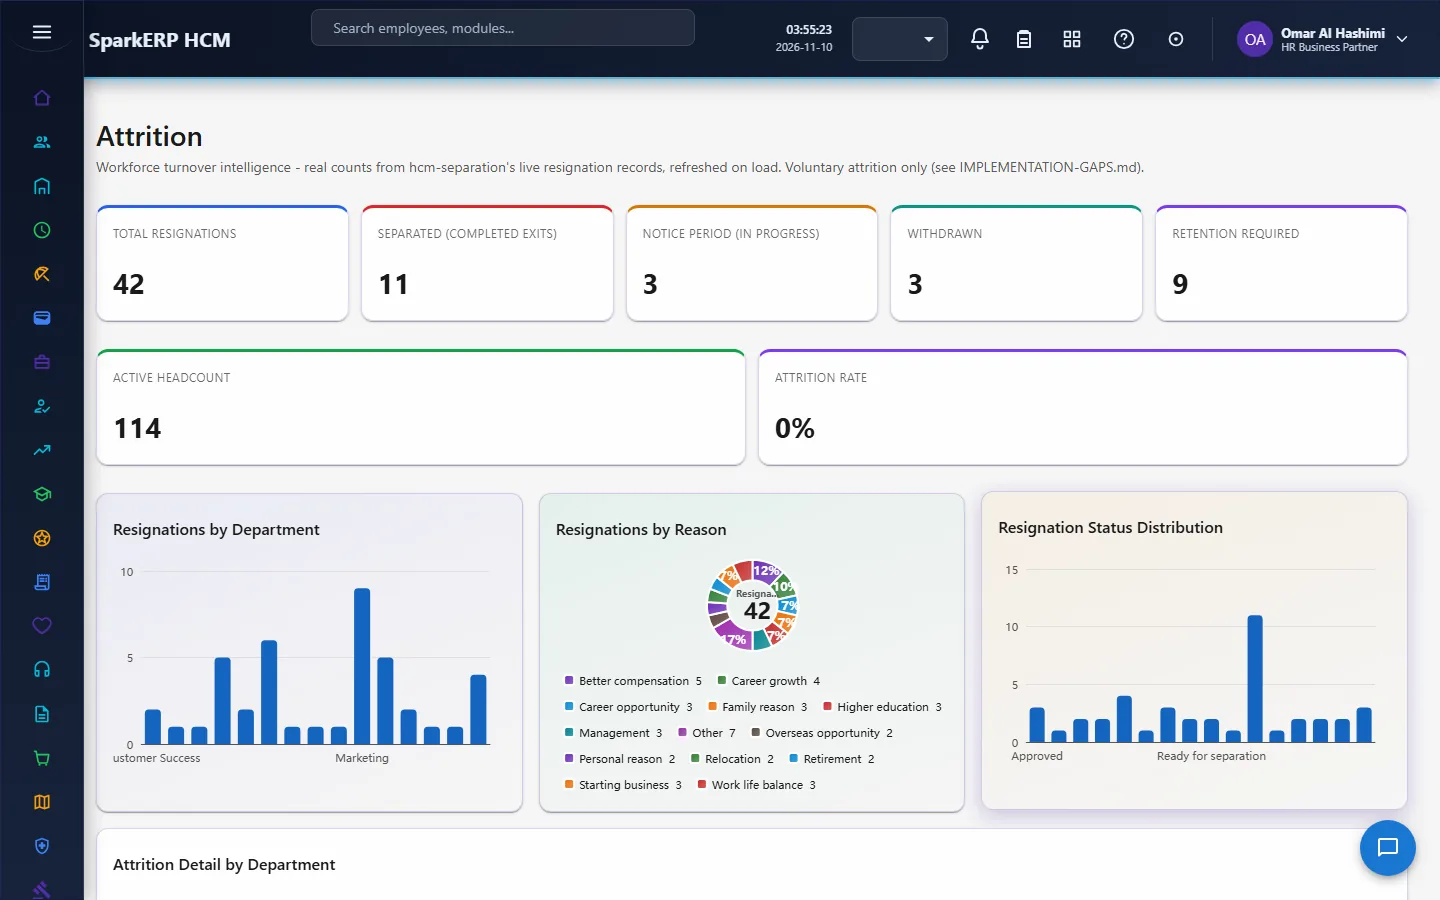
- Attrition rate: inactive employees as a share of all employees.
- Resignations: in the last 30 days against the 31 to 60 days before, per month over the last 12 months, and in notice period. Withdrawn resignations are left out.
- Resignations by reason, by department, by status and by length of service (under 1 year, 1 to 2 years, over 2 years).
- Average tenure at exit: the average days between the hire date and the resignation date.
- First-90-day exits: hires who resigned within 90 days of being hired, as a share of all hires.
- Regretted exits: appraisals rated top for people who resigned. One person with several top ratings counts more than once.
3.3 Attendance, leave and overtime
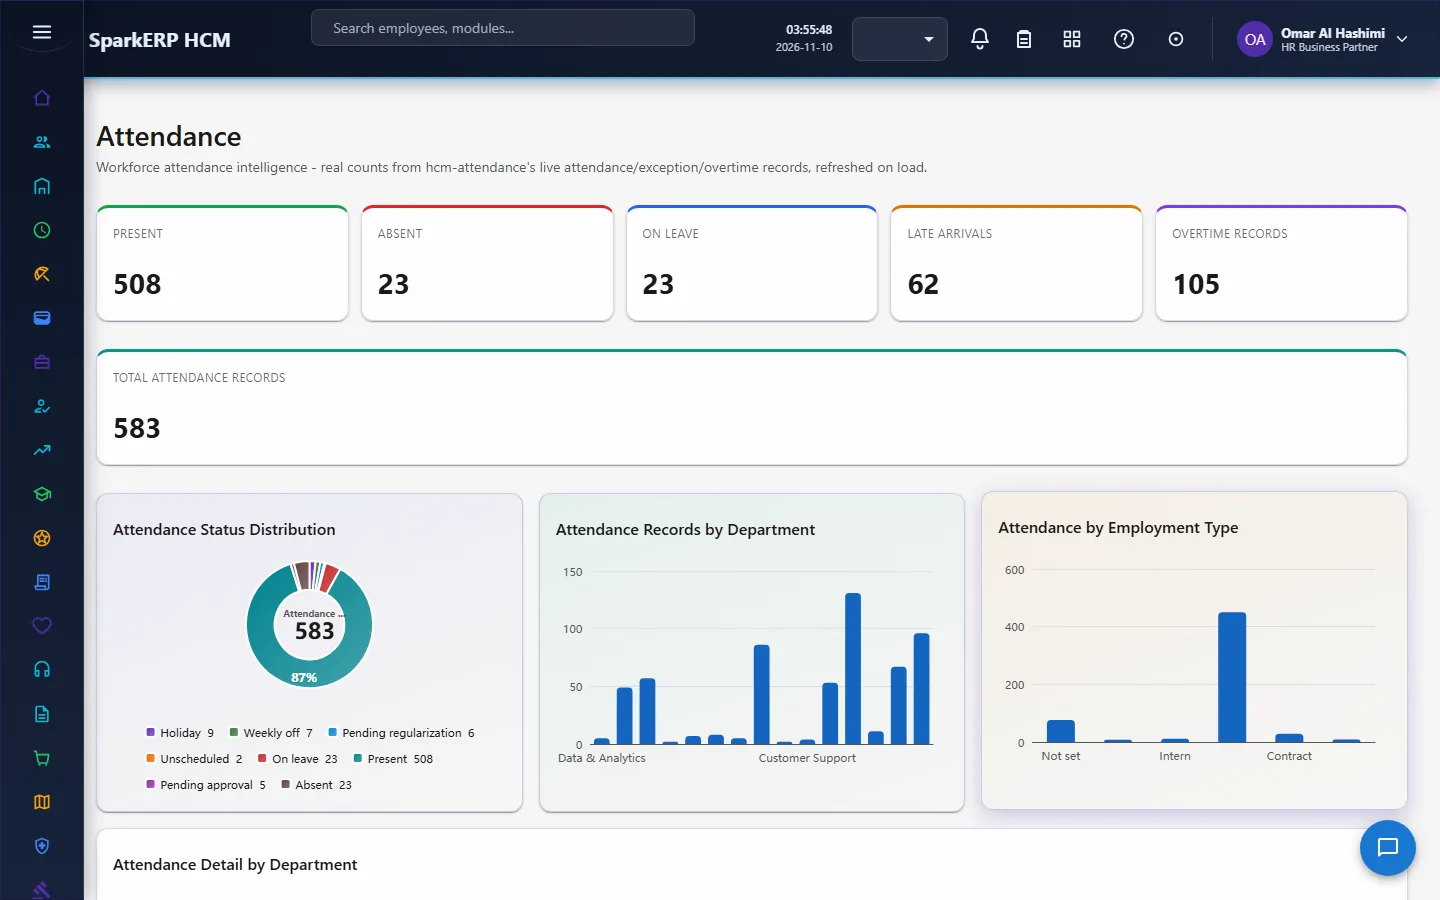
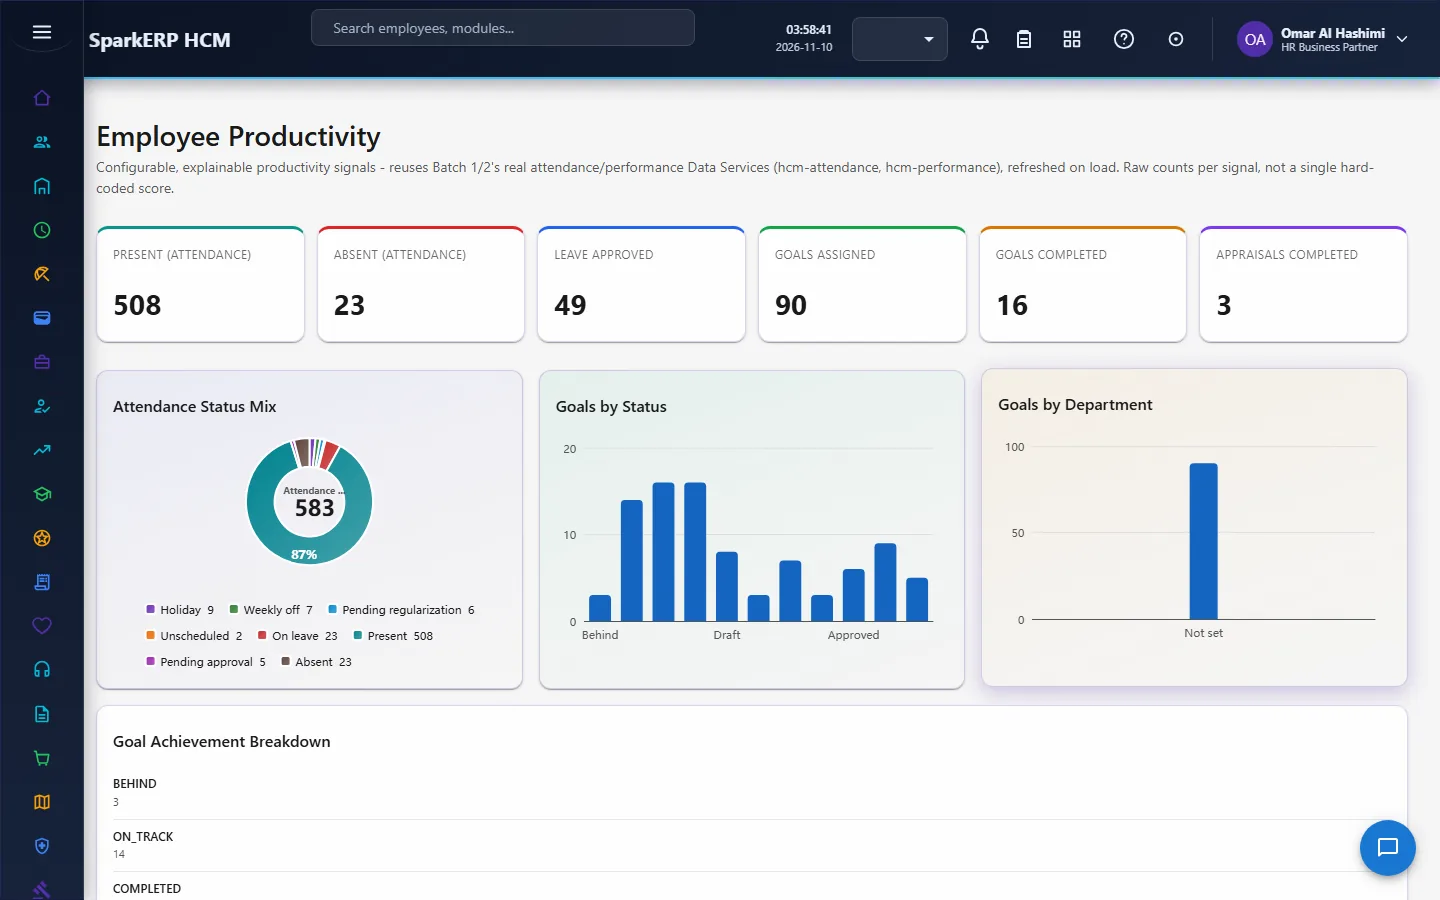
- Absence rate: absent days as a share of absent, present and on-leave days over the last 30 days, shown against the 30 days before.
- Attendance by status, department and employment type.
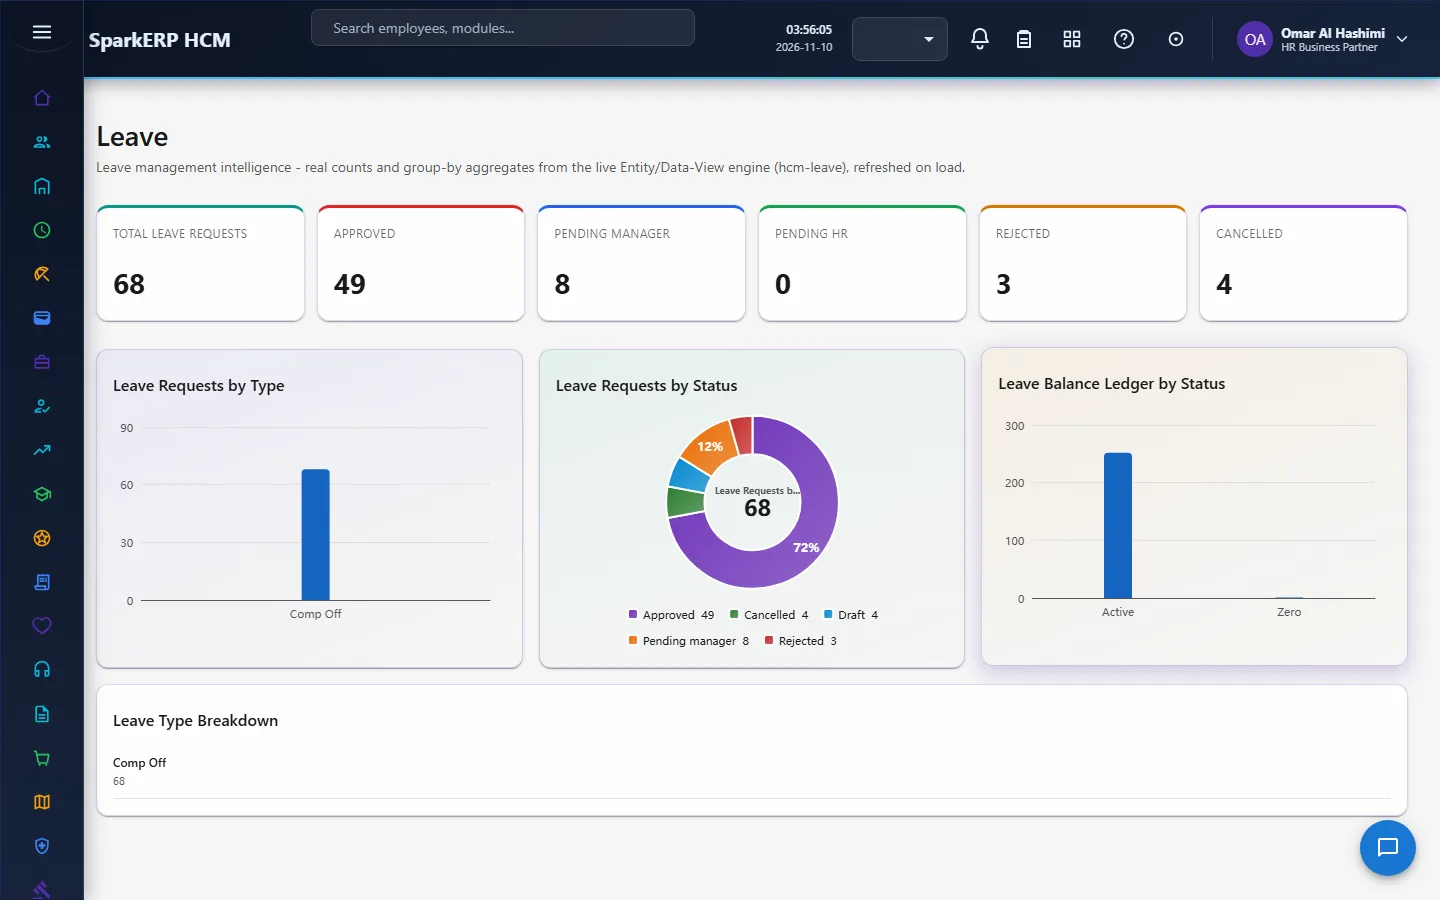
- Leave: leave requests starting in the last 30 days, requests waiting on HR, requests created 31 to 60 days ago, leave by status and by type, and leave balances by status.
- Overtime cost: the total calculated overtime pay, the last 30 days against the 30 days before, and by department.
3.4 Payroll and workforce cost
- Pay runs: all, failed and waiting for approval, by status and by frequency, and the most recent runs and where each stands. Off-cycle runs (bonus, final settlement and so on) are counted separately.
- Gross pay: of runs paid in the last 30 days, the 30 days before, and the last 12 months; the gross and net pay by month from calculated, approved, finalized and published runs.
- Workforce cost: the total gross pay, net pay, deductions and employer contributions, and gross pay by frequency.
- Cost per employee: gross pay per employee, the sum of gross pay over the sum of employees across good runs.
- Payroll accuracy: payslip lines without an exception message as a share of all lines.
- Variance flags: employee pay results flagged because net pay moved more than the allowed limit.
- Adjustments: created in the last 30 days, waiting for approval, and 31 to 60 days ago.
- Bank transfer batches: by status, and failed.
3.5 Pay equity
- Pay ratio, women to men: the average base salary of women as a percent of men's (100 means equal), for active staff on a current compensation record.
- Pay ratio by grade: the same, within each grade (like for like); a grade with fewer than 5 people on a record is left out.
- Average salary by gender: groups under 5 are left out.
3.6 Performance and compensation
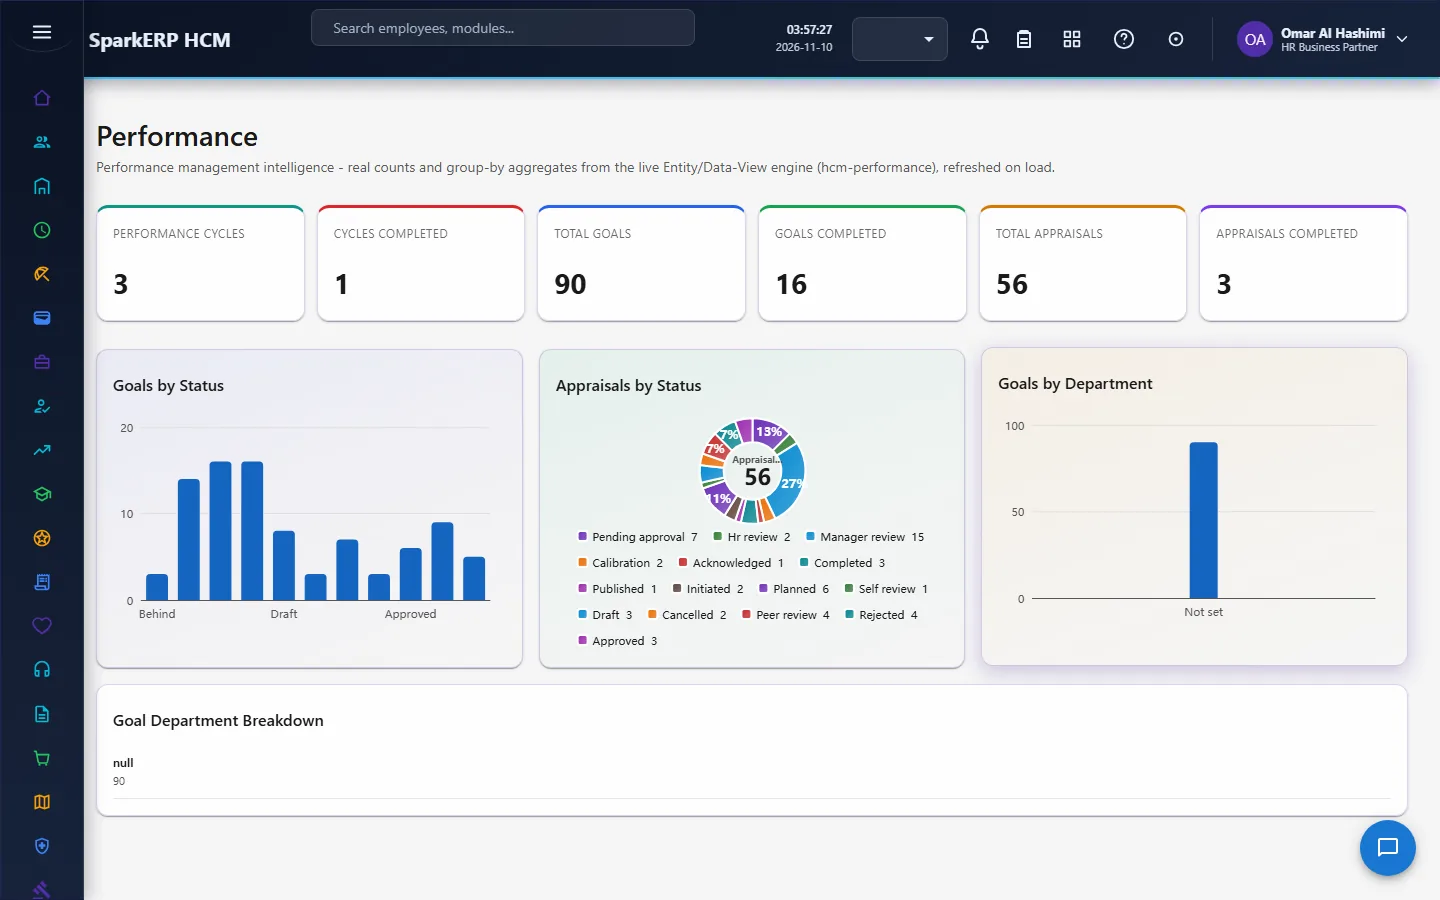
- Appraisals by status, goals by status and by department.
- Overdue appraisals: appraisals still in progress whose period has ended.
- Compensation: salary reviews, merit increases and bonus plans by status or type.
3.7 Recruitment
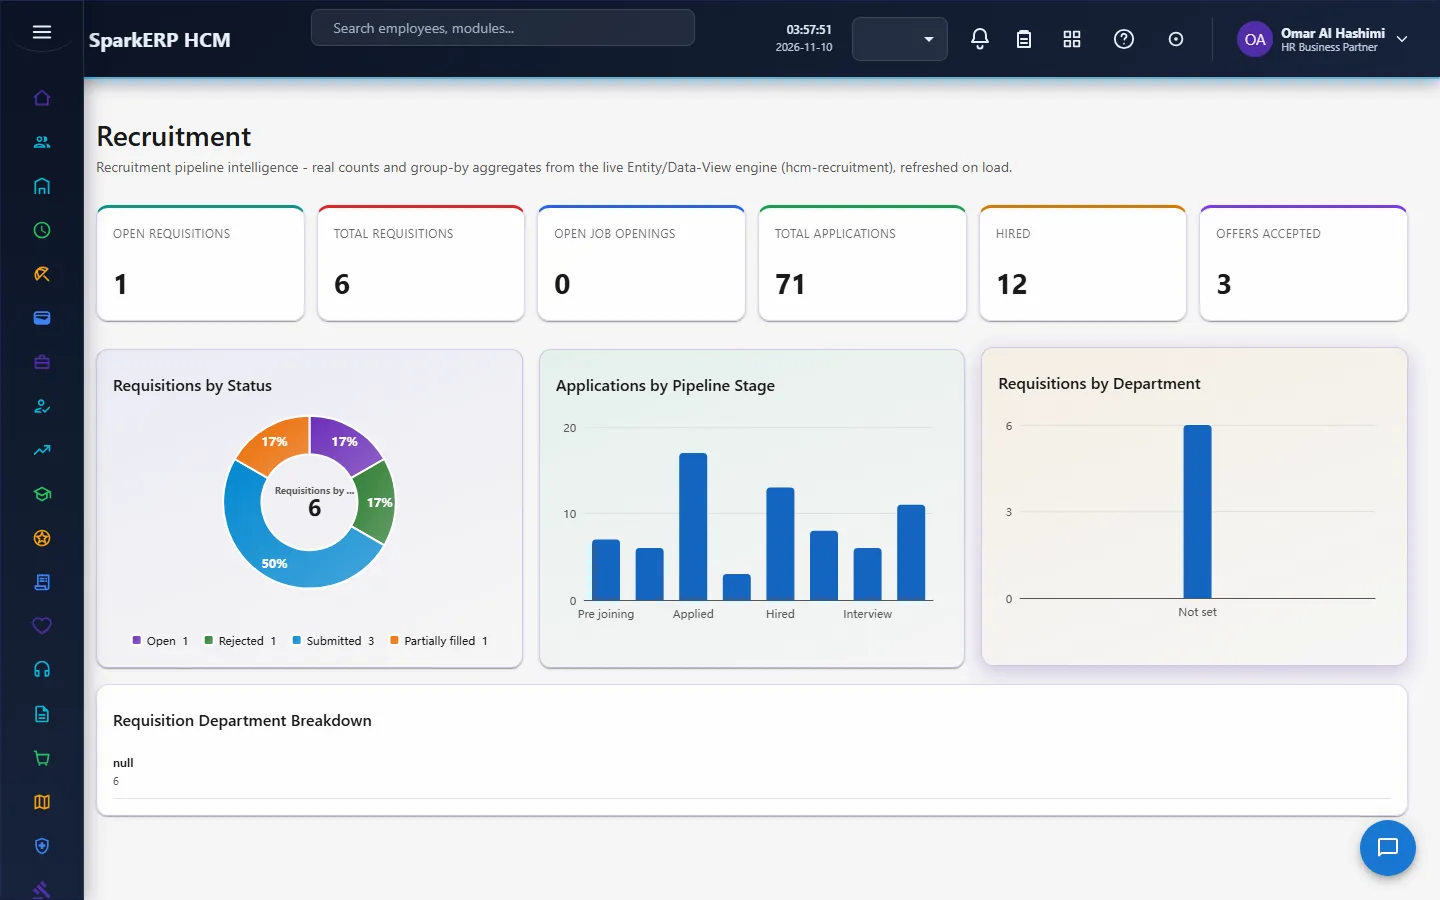
- Requisitions: open, opened in the last 30 days against the 30 days before, by department and by status, and by age (under 30, 31 to 60, 61 to 90 and over 90 days).
- Applications: total, the last 30 days against the 30 days before, by stage and by source.
- Hire rate: hired applications as a share of all applications.
- Offer acceptance: accepted offers as a share of offers the candidate answered (accepted or rejected).
- Time to hire: the average days from the requisition request to the hire, counting only hires dated on or after the request.
- Quality of hire (first signals): the share of hires whose employee record is still active, and the average final appraisal rating of people hired through recruitment.
- Interviews in the next 7 days. Applications and hires by gender (groups under 5 left out).
- Recruiting spend: the latest year's figure from the company figures.
3.8 Onboarding, training, engagement and risk
- Onboarding: cases by status, cases in progress, and the average progress of the cases in progress.
- Probation: employees whose probation ends in the next 30 days.
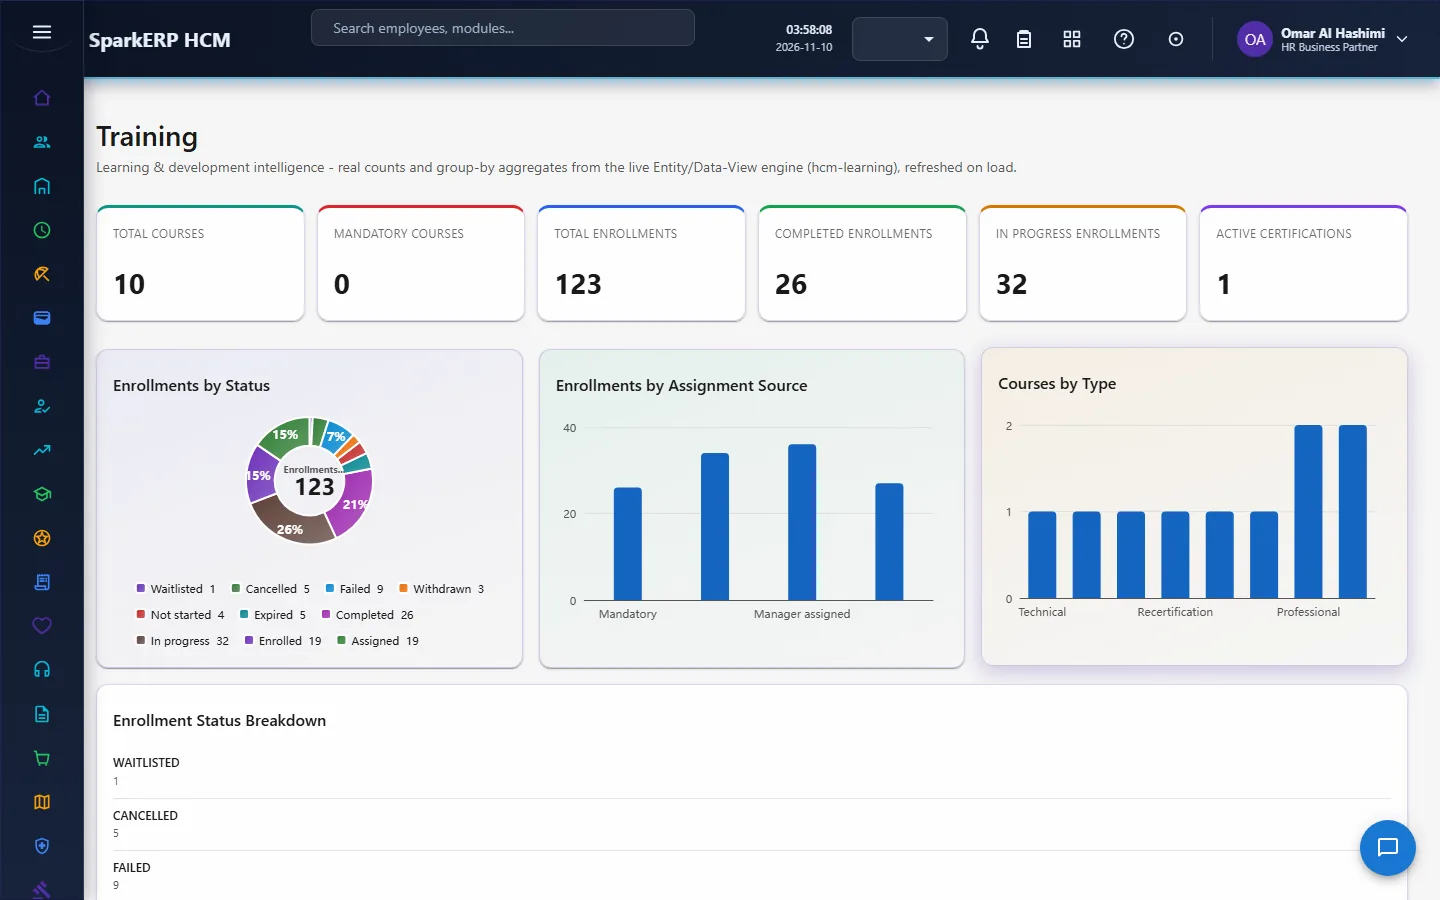
- Training: courses by type, enrolments by status and by source.
- Engagement: the average engagement survey score (0 to 100); the average of the daily mood check-ins and pulse surveys over the last 30 days against the 30 days before; the average sentiment per month over 12 months; and the employee Net Promoter Score: the share of promoters (score 90 and over) minus the share of detractors (score under 70) among the answers.
- Employee relations cases: open, opened in the last 30 days against the 30 days before, and by age (under 30, 31 to 90 and over 90 days).
- Succession: critical roles at risk (succession plans at high risk).
- Statutory filings: filings due in the next 60 days and filings past their due date and not done.
- Company figures: the annual revenue and similar figures entered so far, newest year first.
3.9 The Report Builder
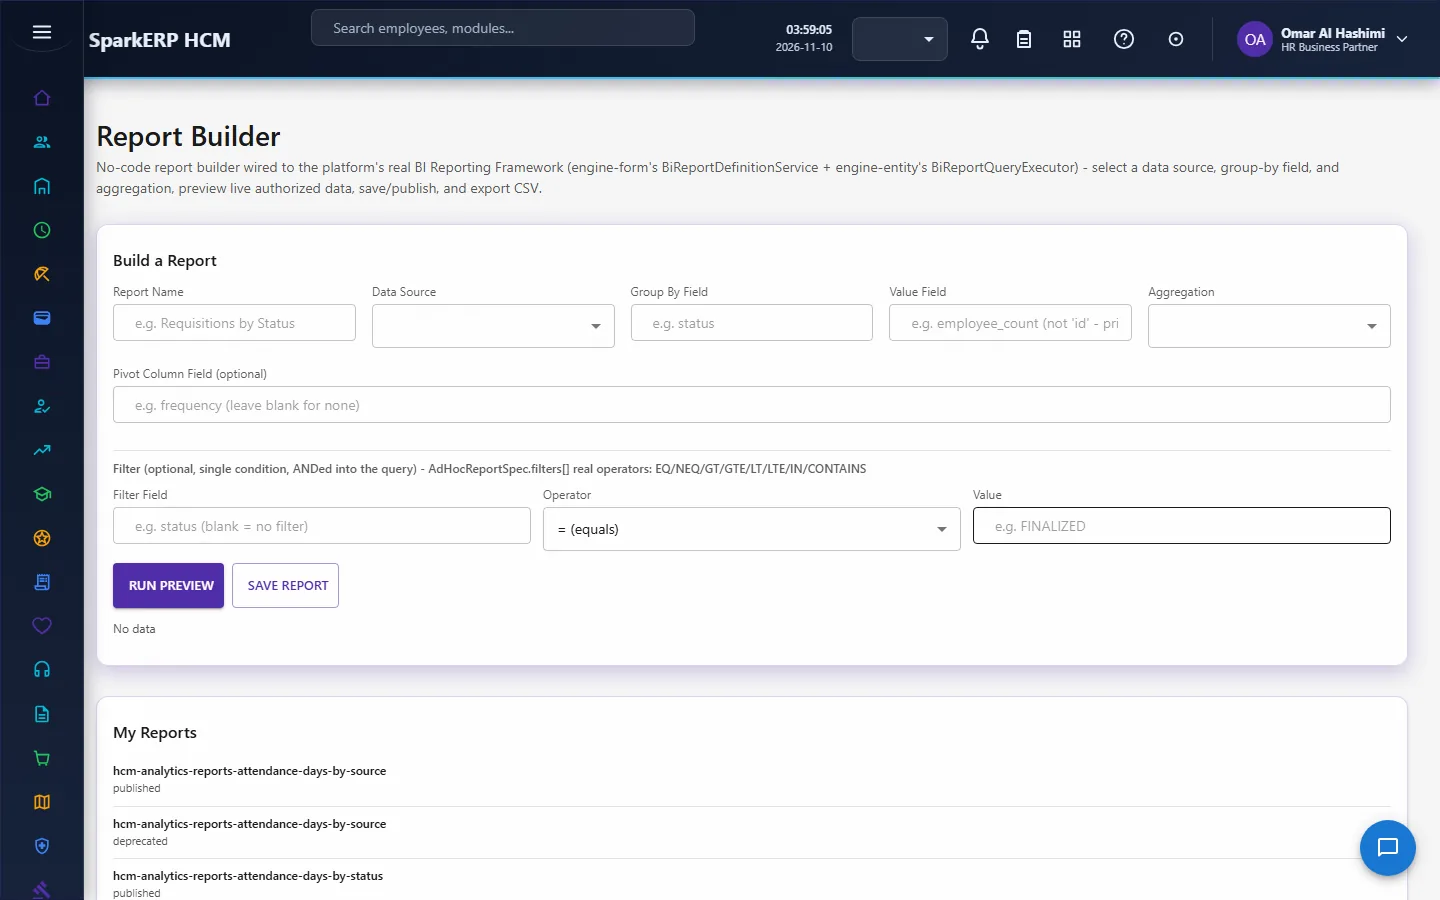
The Report Builder is wired to the platform's own reporting framework. You choose a data source, a field to group by, a field to total and an aggregation, optionally a pivot column and one filter (equal, not equal, greater, less, in, contains), preview it live, and run it or export it as CSV. A few reports ship ready to run: attendance days by source, attendance days by status, late and early records by kind, and overtime by type and status.
4. Who does what
| Role | What they do |
|---|---|
| HCM Analytics Administrator | Builds reports; reads every dashboard. |
| HR Analytics Viewer | Reads the dashboards. |
| HR roles and the auditor | Read the dashboards. |
| Employee and line manager | Have no Analytics dashboards. A manager sees their own team in the Manager Self-Service screens. |
4a. What each role sees, screen by screen
The employee and the manager
Neither opens the Analytics dashboards: they show headcount, pay and attrition for the whole organization.
The executive and HR
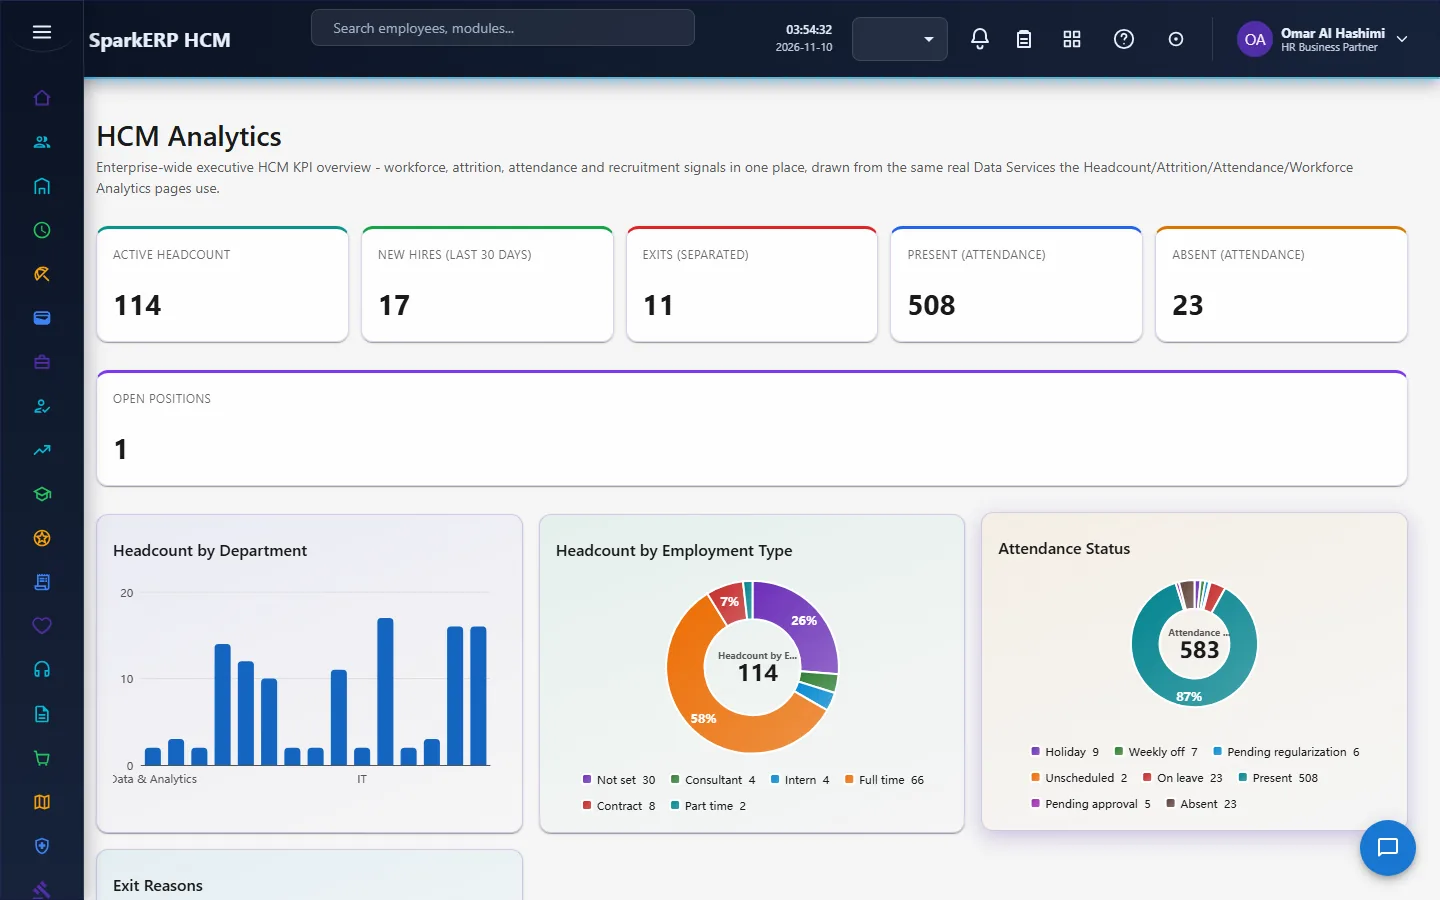
The HCM Analytics dashboard is the headline picture, and Workforce Analytics the detail.
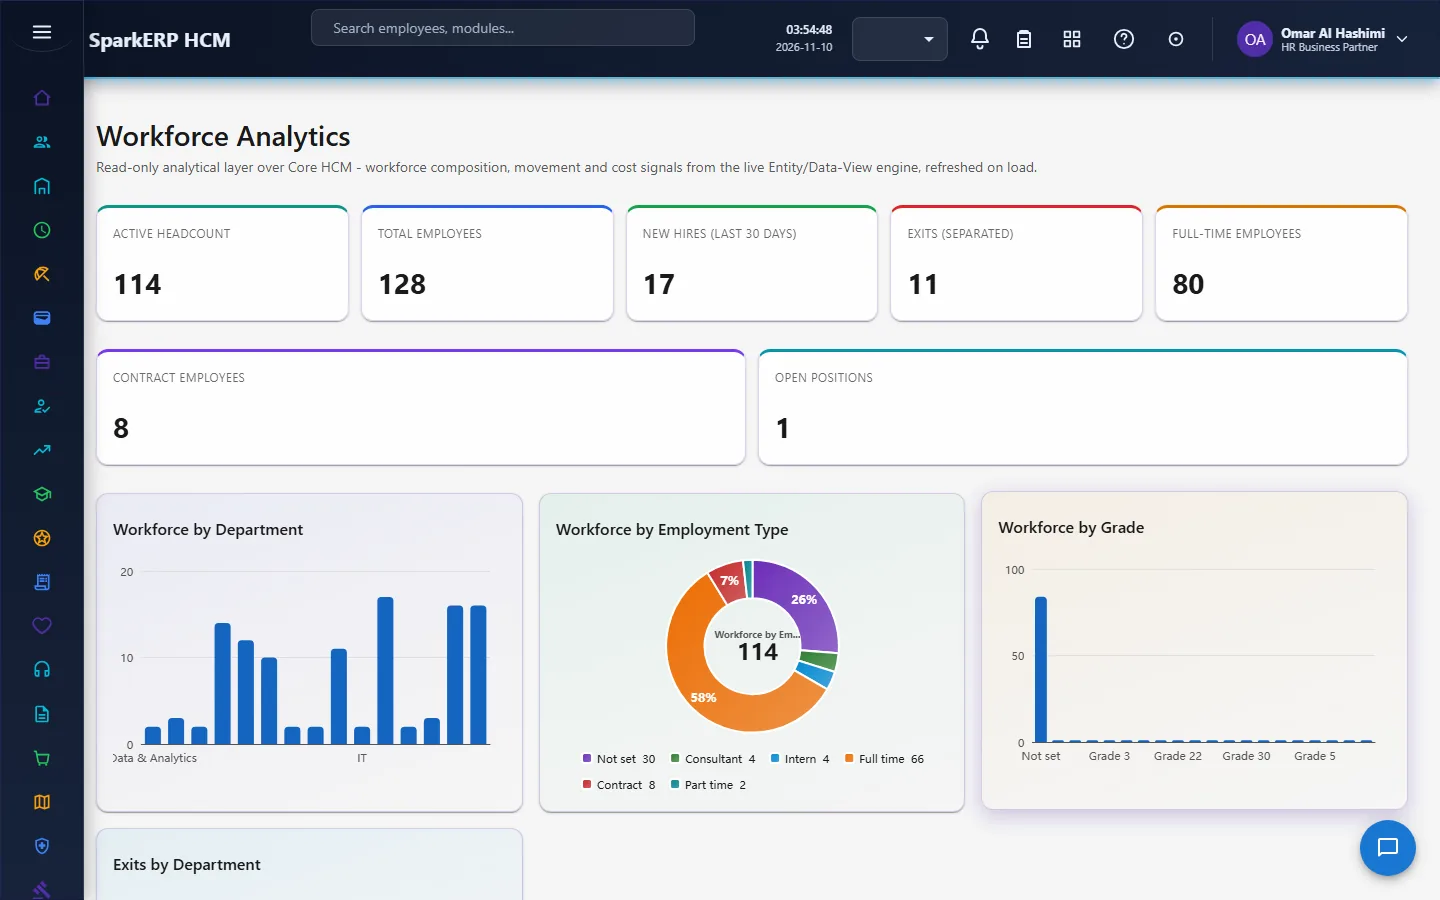
Headcount, Attrition, Attendance and Leave cover the people.
Payroll, Workforce Cost and Compensation cover the money.
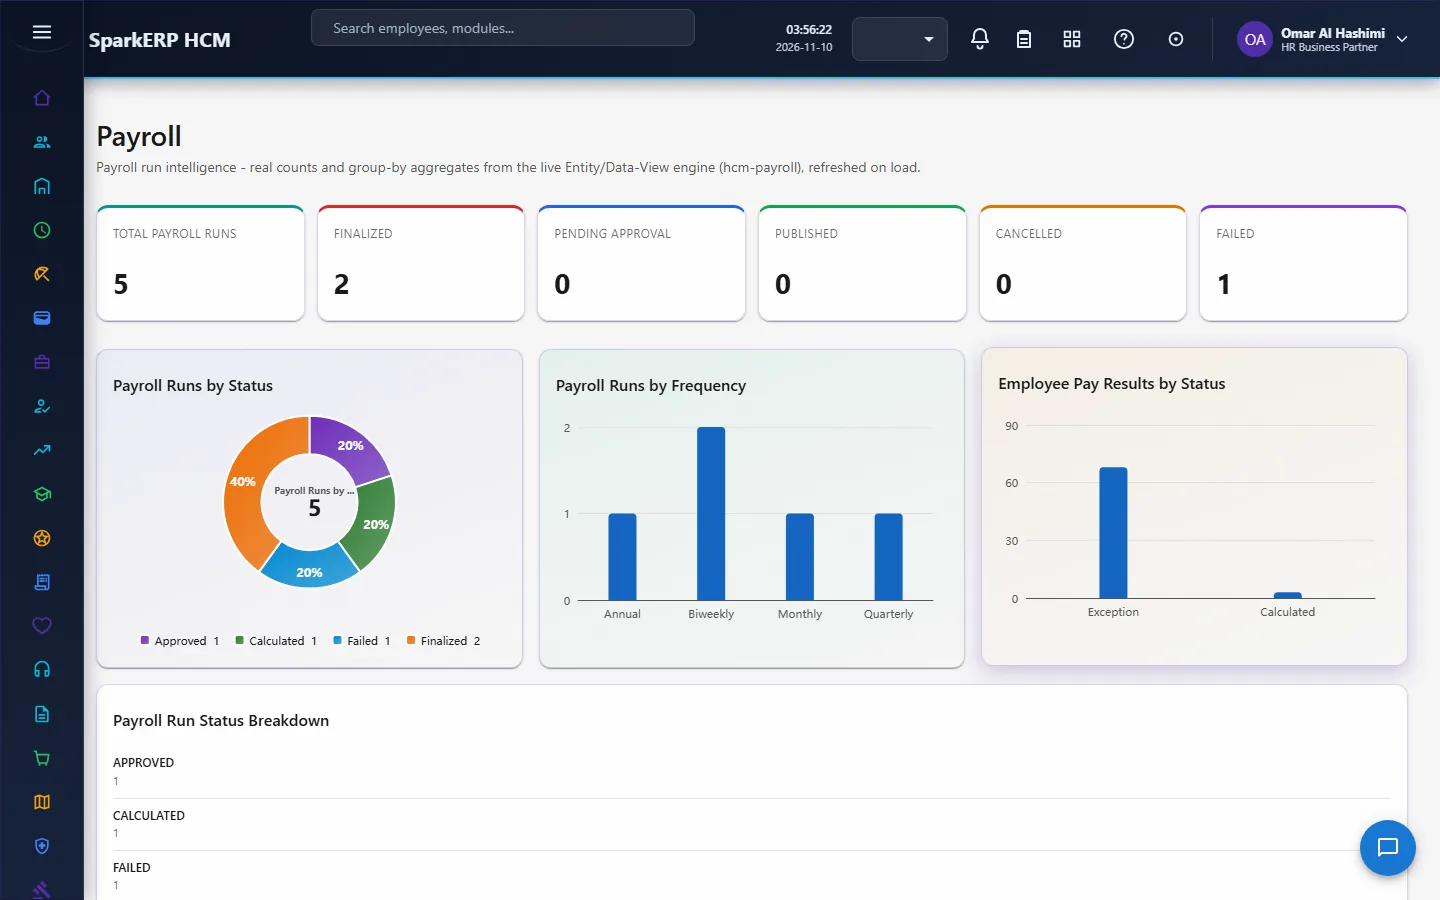
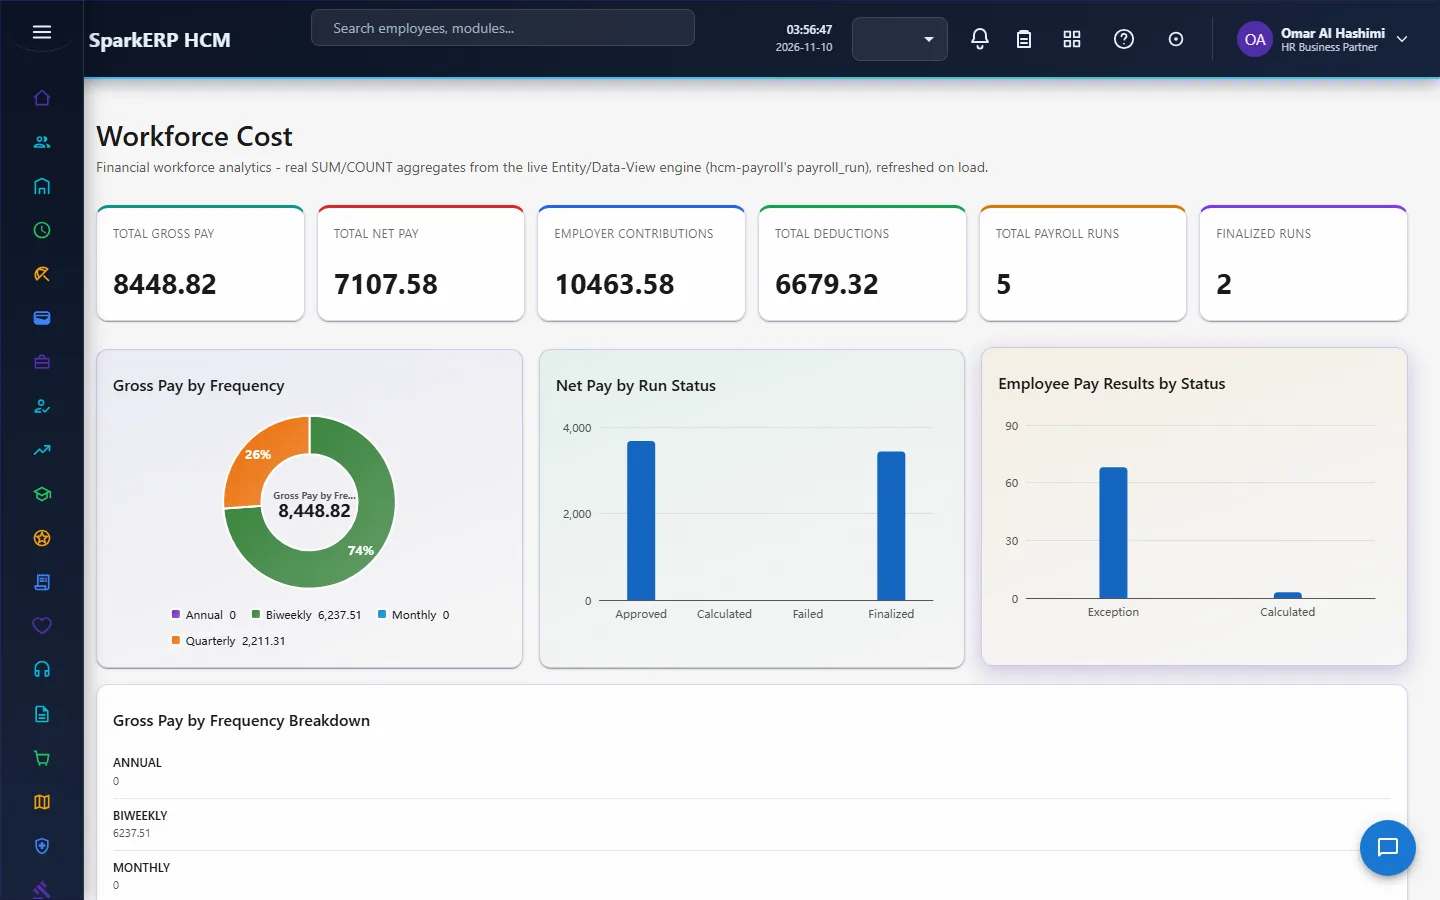
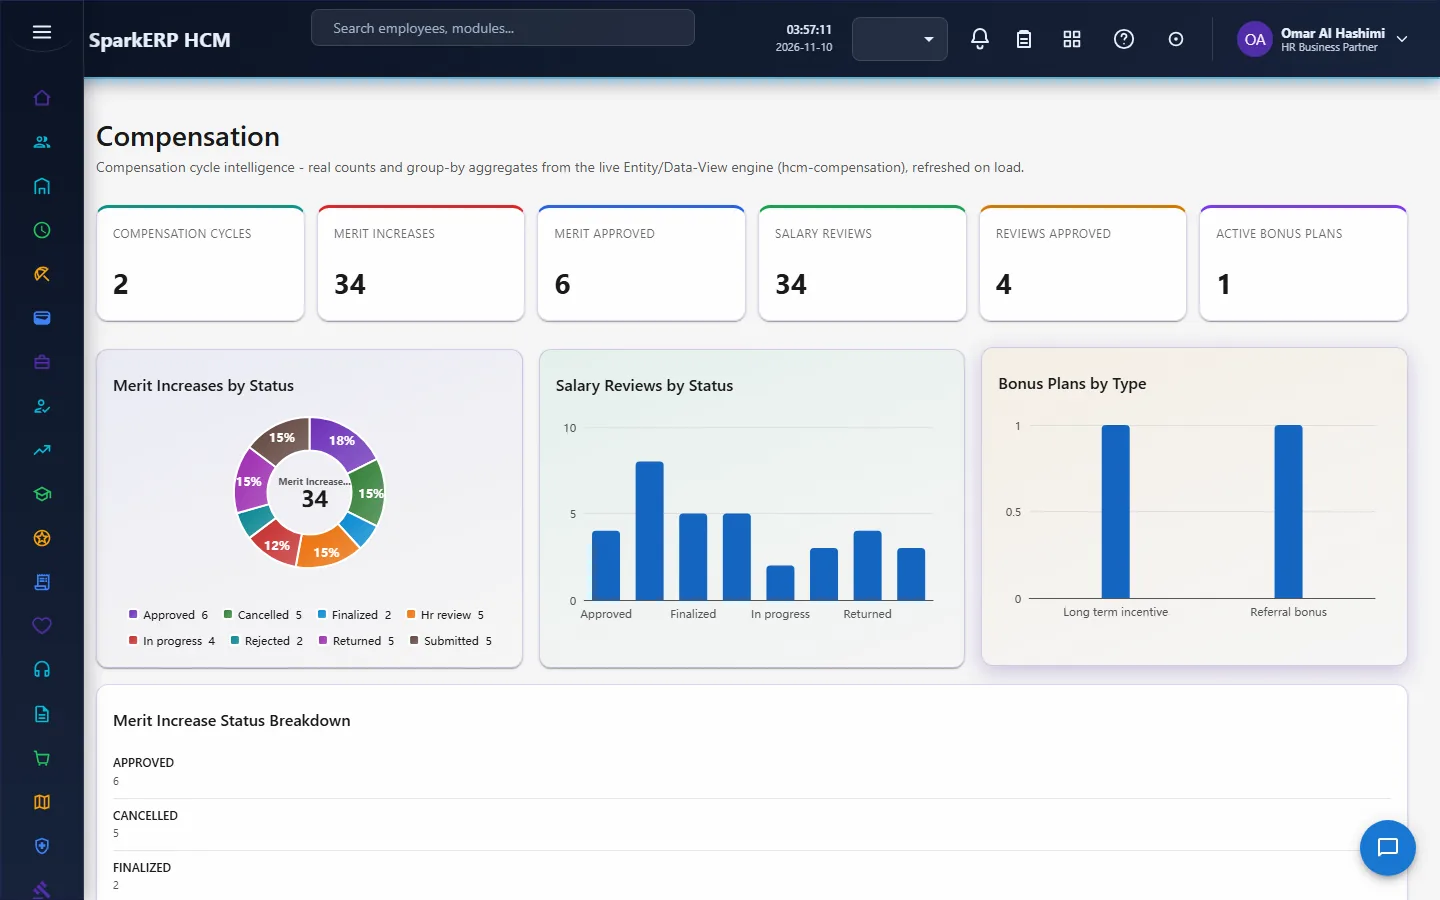
Performance, Recruitment and Training cover growth.
Diversity & Inclusion, Employee Productivity and the Report Builder complete it.
5. Set up
- Roles. Give the HCM Analytics Administrator and HR Analytics Viewer roles.
- Data. The dashboards read the HR records, so the better those are kept (department filled in, hire dates, compensation records, appraisals), the better the figures.
- Company figures. Enter annual revenue and recruiting spend if you want the measures that use them.
- Trial. In a trial tenant generate the demo packs of the modules you use; every dashboard has data when the underlying modules do.
6. Daily use
- Open HCM Analytics for the headline picture and compare each measure with the period before.
- Open the dashboard of the area you care about and read the breakdowns.
- Use the Report Builder for a question no dashboard answers, and export the result.
7. Limits you should know about
- Live figures depend on the records. A missing department, hire date or compensation record shows up as a gap, not as a guess.
- Groups under 5 are hidden in the breakdowns that could identify a person.
- The dashboards read; they do not forecast or change anything.
- Quality of hire is a first signal only: the share of hires still employed and their average rating.
- A page can be opened by someone who may not read every area (each data view has its own permission), so a figure can be refused on a page you may open.
8. Troubleshooting
| Symptom | Cause and fix |
|---|---|
| A breakdown is missing a group | The group has fewer than 5 people. |
| A figure looks too low | The underlying records are incomplete (no department, no compensation record). |
| A page shows a refused figure | You may open the page but not read that area's data; ask for the area's role. |
| The rate looks wrong | Check the definition in section 3: for example attrition is inactive employees over all employees. |
| An employee or manager cannot open a dashboard | The dashboards show the whole organization. |